Warning: Trying to access array offset on null in /home/especiais/epsatisep/public_html/2020/EPS2020-wiki4/lib/plugins/caption/syntax/reference.php on line 68
Warning: Undefined array key "TableFunctionalTests" in /home/especiais/epsatisep/public_html/2020/EPS2020-wiki4/lib/plugins/caption/syntax/reference.php on line 68
Warning: Undefined array key "pt" in /home/especiais/epsatisep/public_html/2020/EPS2020-wiki4/lib/plugins/caption/syntax/reference.php on line 68
Warning: Undefined array key "planner" in /home/especiais/epsatisep/public_html/2020/EPS2020-wiki4/lib/plugins/caption/syntax/reference.php on line 68
Warning: Undefined array key "TableReportStructure" in /home/especiais/epsatisep/public_html/2020/EPS2020-wiki4/lib/plugins/caption/syntax/reference.php on line 68
Warning: Undefined array key "TableAffordableCyclingComputerOptions" in /home/especiais/epsatisep/public_html/2020/EPS2020-wiki4/lib/plugins/caption/syntax/reference.php on line 68
Warning: Undefined array key "HighEndOptions" in /home/especiais/epsatisep/public_html/2020/EPS2020-wiki4/lib/plugins/caption/syntax/reference.php on line 68
Warning: Undefined array key "TableSpecialOptions" in /home/especiais/epsatisep/public_html/2020/EPS2020-wiki4/lib/plugins/caption/syntax/reference.php on line 68
Warning: Undefined array key "TableAirpollutionproductscreatingmaps" in /home/especiais/epsatisep/public_html/2020/EPS2020-wiki4/lib/plugins/caption/syntax/reference.php on line 68
Warning: Undefined array key "wbs" in /home/especiais/epsatisep/public_html/2020/EPS2020-wiki4/lib/plugins/caption/syntax/reference.php on line 68
Warning: Undefined array key "Gantt1" in /home/especiais/epsatisep/public_html/2020/EPS2020-wiki4/lib/plugins/caption/syntax/reference.php on line 68
Warning: Undefined array key "Gantt1" in /home/especiais/epsatisep/public_html/2020/EPS2020-wiki4/lib/plugins/caption/syntax/reference.php on line 68
Warning: Undefined array key "TableOfComponents" in /home/especiais/epsatisep/public_html/2020/EPS2020-wiki4/lib/plugins/caption/syntax/reference.php on line 68
Warning: Undefined array key "ResponsibiliyMatrix" in /home/especiais/epsatisep/public_html/2020/EPS2020-wiki4/lib/plugins/caption/syntax/reference.php on line 68
Warning: Undefined array key "Communication" in /home/especiais/epsatisep/public_html/2020/EPS2020-wiki4/lib/plugins/caption/syntax/reference.php on line 68
Warning: Undefined array key "Risks" in /home/especiais/epsatisep/public_html/2020/EPS2020-wiki4/lib/plugins/caption/syntax/reference.php on line 68
Warning: Undefined array key 1 in /home/especiais/epsatisep/public_html/2020/EPS2020-wiki4/lib/plugins/caption/syntax/caption.php on line 109
Warning: Undefined array key "Stakeholders" in /home/especiais/epsatisep/public_html/2020/EPS2020-wiki4/lib/plugins/caption/syntax/reference.php on line 68
Warning: Undefined array key "stakeholders" in /home/especiais/epsatisep/public_html/2020/EPS2020-wiki4/lib/plugins/caption/syntax/reference.php on line 68
Warning: Undefined array key "TableSprintPlanning" in /home/especiais/epsatisep/public_html/2020/EPS2020-wiki4/lib/plugins/caption/syntax/reference.php on line 68
Warning: Undefined array key "retrospectives" in /home/especiais/epsatisep/public_html/2020/EPS2020-wiki4/lib/plugins/caption/syntax/reference.php on line 68
Warning: Undefined array key "pestleanalysis" in /home/especiais/epsatisep/public_html/2020/EPS2020-wiki4/lib/plugins/caption/syntax/reference.php on line 68
Warning: Undefined array key "pestleanalysisGO" in /home/especiais/epsatisep/public_html/2020/EPS2020-wiki4/lib/plugins/caption/syntax/reference.php on line 68
Warning: Undefined array key "CompetitiveMatrix" in /home/especiais/epsatisep/public_html/2020/EPS2020-wiki4/lib/plugins/caption/syntax/reference.php on line 68
Warning: Undefined array key "WorldGDP" in /home/especiais/epsatisep/public_html/2020/EPS2020-wiki4/lib/plugins/caption/syntax/reference.php on line 68
Warning: Undefined array key "EuropeGDP" in /home/especiais/epsatisep/public_html/2020/EPS2020-wiki4/lib/plugins/caption/syntax/reference.php on line 68
Warning: Undefined array key "PhoneRate" in /home/especiais/epsatisep/public_html/2020/EPS2020-wiki4/lib/plugins/caption/syntax/reference.php on line 68
Warning: Undefined array key "EuropeBikeSales" in /home/especiais/epsatisep/public_html/2020/EPS2020-wiki4/lib/plugins/caption/syntax/reference.php on line 68
Warning: Undefined array key "teamSWOT" in /home/especiais/epsatisep/public_html/2020/EPS2020-wiki4/lib/plugins/caption/syntax/reference.php on line 68
Warning: Undefined array key "GOairSWOT" in /home/especiais/epsatisep/public_html/2020/EPS2020-wiki4/lib/plugins/caption/syntax/reference.php on line 68
Warning: Undefined array key "SMTG" in /home/especiais/epsatisep/public_html/2020/EPS2020-wiki4/lib/plugins/caption/syntax/reference.php on line 68
Warning: Undefined array key "motivation" in /home/especiais/epsatisep/public_html/2020/EPS2020-wiki4/lib/plugins/caption/syntax/reference.php on line 68
Warning: Undefined array key "bikeuser" in /home/especiais/epsatisep/public_html/2020/EPS2020-wiki4/lib/plugins/caption/syntax/reference.php on line 68
Warning: Undefined array key "PositioningMatrix" in /home/especiais/epsatisep/public_html/2020/EPS2020-wiki4/lib/plugins/caption/syntax/reference.php on line 68
Warning: Undefined array key "MarketingMix" in /home/especiais/epsatisep/public_html/2020/EPS2020-wiki4/lib/plugins/caption/syntax/reference.php on line 68
Warning: Undefined array key "budget" in /home/especiais/epsatisep/public_html/2020/EPS2020-wiki4/lib/plugins/caption/syntax/reference.php on line 68
Warning: Undefined array key "Fb" in /home/especiais/epsatisep/public_html/2020/EPS2020-wiki4/lib/plugins/caption/syntax/reference.php on line 68
Warning: Undefined array key "Insta" in /home/especiais/epsatisep/public_html/2020/EPS2020-wiki4/lib/plugins/caption/syntax/reference.php on line 68
Warning: Undefined array key "leaflet" in /home/especiais/epsatisep/public_html/2020/EPS2020-wiki4/lib/plugins/caption/syntax/reference.php on line 68
Warning: Undefined array key "citybikes" in /home/especiais/epsatisep/public_html/2020/EPS2020-wiki4/lib/plugins/caption/syntax/reference.php on line 68
Warning: Undefined array key "PDCA" in /home/especiais/epsatisep/public_html/2020/EPS2020-wiki4/lib/plugins/caption/syntax/reference.php on line 68
Warning: Undefined array key "threepillars" in /home/especiais/epsatisep/public_html/2020/EPS2020-wiki4/lib/plugins/caption/syntax/reference.php on line 68
Warning: Undefined array key "sdg" in /home/especiais/epsatisep/public_html/2020/EPS2020-wiki4/lib/plugins/caption/syntax/reference.php on line 68
Warning: Undefined array key "goal11" in /home/especiais/epsatisep/public_html/2020/EPS2020-wiki4/lib/plugins/caption/syntax/reference.php on line 68
Warning: Undefined array key "goal7" in /home/especiais/epsatisep/public_html/2020/EPS2020-wiki4/lib/plugins/caption/syntax/reference.php on line 68
Warning: Undefined array key "energyworld" in /home/especiais/epsatisep/public_html/2020/EPS2020-wiki4/lib/plugins/caption/syntax/reference.php on line 68
Warning: Undefined array key "lcastages" in /home/especiais/epsatisep/public_html/2020/EPS2020-wiki4/lib/plugins/caption/syntax/reference.php on line 68
Warning: Undefined array key "GOlcastages" in /home/especiais/epsatisep/public_html/2020/EPS2020-wiki4/lib/plugins/caption/syntax/reference.php on line 68
Warning: Undefined array key "reusability" in /home/especiais/epsatisep/public_html/2020/EPS2020-wiki4/lib/plugins/caption/syntax/reference.php on line 68
Warning: Undefined array key "packaging_solution_3" in /home/especiais/epsatisep/public_html/2020/EPS2020-wiki4/lib/plugins/caption/syntax/reference.php on line 68
Warning: Undefined array key "moodboard_look_feel" in /home/especiais/epsatisep/public_html/2020/EPS2020-wiki4/lib/plugins/caption/syntax/reference.php on line 68
Warning: Undefined array key "structural_draft_2" in /home/especiais/epsatisep/public_html/2020/EPS2020-wiki4/lib/plugins/caption/syntax/reference.php on line 68
Warning: Undefined array key "structural_draft_1" in /home/especiais/epsatisep/public_html/2020/EPS2020-wiki4/lib/plugins/caption/syntax/reference.php on line 68
Warning: Undefined array key "bbbicycleprobe" in /home/especiais/epsatisep/public_html/2020/EPS2020-wiki4/lib/plugins/caption/syntax/reference.php on line 68
Warning: Undefined array key "final_sketch" in /home/especiais/epsatisep/public_html/2020/EPS2020-wiki4/lib/plugins/caption/syntax/reference.php on line 68
Warning: Undefined array key "Model" in /home/especiais/epsatisep/public_html/2020/EPS2020-wiki4/lib/plugins/caption/syntax/reference.php on line 68
Warning: Undefined array key "schematic" in /home/especiais/epsatisep/public_html/2020/EPS2020-wiki4/lib/plugins/caption/syntax/reference.php on line 68
Warning: Undefined array key "AirQuality" in /home/especiais/epsatisep/public_html/2020/EPS2020-wiki4/lib/plugins/caption/syntax/reference.php on line 68
Warning: Undefined array key "Dynamo" in /home/especiais/epsatisep/public_html/2020/EPS2020-wiki4/lib/plugins/caption/syntax/reference.php on line 68
Warning: Undefined array key "Battery" in /home/especiais/epsatisep/public_html/2020/EPS2020-wiki4/lib/plugins/caption/syntax/reference.php on line 68
Warning: Undefined array key "ArduinoCompare" in /home/especiais/epsatisep/public_html/2020/EPS2020-wiki4/lib/plugins/caption/syntax/reference.php on line 68
Warning: Undefined array key "Step-up" in /home/especiais/epsatisep/public_html/2020/EPS2020-wiki4/lib/plugins/caption/syntax/reference.php on line 68
Warning: Undefined array key "LED" in /home/especiais/epsatisep/public_html/2020/EPS2020-wiki4/lib/plugins/caption/syntax/reference.php on line 68
Warning: Undefined array key "Pcalc" in /home/especiais/epsatisep/public_html/2020/EPS2020-wiki4/lib/plugins/caption/syntax/reference.php on line 68
Warning: Undefined array key "kolmedeetulostus" in /home/especiais/epsatisep/public_html/2020/EPS2020-wiki4/lib/plugins/caption/syntax/reference.php on line 68
Warning: Undefined array key "valumuovi" in /home/especiais/epsatisep/public_html/2020/EPS2020-wiki4/lib/plugins/caption/syntax/reference.php on line 68
Warning: Undefined array key "Thermoplastics" in /home/especiais/epsatisep/public_html/2020/EPS2020-wiki4/lib/plugins/caption/syntax/reference.php on line 68
Warning: Undefined array key "usercase" in /home/especiais/epsatisep/public_html/2020/EPS2020-wiki4/lib/plugins/caption/syntax/reference.php on line 68
Warning: Undefined array key "softArd1" in /home/especiais/epsatisep/public_html/2020/EPS2020-wiki4/lib/plugins/caption/syntax/reference.php on line 68
Warning: Undefined array key "softArd2" in /home/especiais/epsatisep/public_html/2020/EPS2020-wiki4/lib/plugins/caption/syntax/reference.php on line 68
Warning: Undefined array key "light" in /home/especiais/epsatisep/public_html/2020/EPS2020-wiki4/lib/plugins/caption/syntax/reference.php on line 68
Warning: Undefined array key "air" in /home/especiais/epsatisep/public_html/2020/EPS2020-wiki4/lib/plugins/caption/syntax/reference.php on line 68
Warning: Undefined array key "temp" in /home/especiais/epsatisep/public_html/2020/EPS2020-wiki4/lib/plugins/caption/syntax/reference.php on line 68
Warning: Undefined array key "loop" in /home/especiais/epsatisep/public_html/2020/EPS2020-wiki4/lib/plugins/caption/syntax/reference.php on line 68
Warning: Undefined array key "index" in /home/especiais/epsatisep/public_html/2020/EPS2020-wiki4/lib/plugins/caption/syntax/reference.php on line 68
Warning: Undefined array key "login" in /home/especiais/epsatisep/public_html/2020/EPS2020-wiki4/lib/plugins/caption/syntax/reference.php on line 68
Warning: Undefined array key "reset" in /home/especiais/epsatisep/public_html/2020/EPS2020-wiki4/lib/plugins/caption/syntax/reference.php on line 68
Warning: Undefined array key "signup" in /home/especiais/epsatisep/public_html/2020/EPS2020-wiki4/lib/plugins/caption/syntax/reference.php on line 68
Warning: Undefined array key "map" in /home/especiais/epsatisep/public_html/2020/EPS2020-wiki4/lib/plugins/caption/syntax/reference.php on line 68
Warning: Undefined array key "settings" in /home/especiais/epsatisep/public_html/2020/EPS2020-wiki4/lib/plugins/caption/syntax/reference.php on line 68
Warning: Undefined array key "update" in /home/especiais/epsatisep/public_html/2020/EPS2020-wiki4/lib/plugins/caption/syntax/reference.php on line 68
Warning: Undefined array key "update" in /home/especiais/epsatisep/public_html/2020/EPS2020-wiki4/lib/plugins/caption/syntax/reference.php on line 68
Warning: Undefined array key "firebase" in /home/especiais/epsatisep/public_html/2020/EPS2020-wiki4/lib/plugins/caption/syntax/reference.php on line 68
Warning: Undefined array key "conclusion" in /home/especiais/epsatisep/public_html/2020/EPS2020-wiki4/lib/plugins/caption/syntax/reference.php on line 68
Table of Contents
Report
Bicycle Probe
![]()
Authors:
- Juho Ruusunen
- Kaan Isik
- Logan Smith
- Mélissa Boularas
- Zuzanna Szmytke
Acknowledgement
Glossary
| Abbreviation | Description |
|---|---|
| ABS | Acrylonitrile Butadiene Styrene |
| COP | Conference of Parties |
| COVID-19 | Coronavirus Disease 19 |
| CO2 | Carbon Dioxide |
| CPC | Cost Per Click |
| CPM | Cost Per Impression |
| CRS | Corporate Social Responsability |
| ECTFE | Ethylene chlorotrifluoroethylene |
| EPAC | Electronically Power Assisted Cycles |
| EPS | European Project Semester |
| ERSO | European Road Safety Observatory |
| GDP | Gross Domestic Product |
| GUI | Graphical User Interface |
| IoT | Internet of Things |
| ISEP | Instituto Superior de Engenharia do Porto |
| NO2 | Nitrogen Oxides |
| O3 | Ozone |
| PA | Polyamide |
| PC | Polycarbonate |
| PE-HD | Polyethylene |
| PE-LD | Polyethylene |
| PET, PETE | Polyethylene terephthalate |
| PLA | Polylactic acid |
| PMMA | Poly(methyl methacrylate) |
| POM | Polyoxymethylene |
| PP | Polypropylene |
| PS | Polystyrene |
| PTFE | Polytetrafluoroethylene |
| PVDF | Polyvinylidene fluoride |
| SDGs | Sustainable Development Goals |
1. Introduction
In this paper, we will document the process of creating a bicycle probe device meant to measure the pollution of the air and present the user with the data from other users, along with ensuring their safety. In this chapter, we included a general presentation of our team, goals, and motivations, along with the basic outline of our work methodology.
1.1 Presentation
The group consists of five members (originally six): Zuzanna from Poland, Kaan from Belgium, Juho from Finland, Logan from Scotland, and Melissa from France. Julia from Germany left at the beginning of the project. The different backgrounds give a wide spectrum of resources. All members have experience working in teams to create new products or versions of existing products, nevertheless, the different educations focus on different aspects, e.g. the level of engineering, design, marketing, economy, and creativity. Furthermore, the various backgrounds provide the individual with a new view or level of programs, methods, and priorities within the focus areas. Information about our team is displayed in the Table 1.
| Zuzanna Szmytke | Kaan Isik | Juho Ruusunen | Logan Smith | Melissa Boularas | |
|---|---|---|---|---|---|
| Country | Poland | Belgium | Finland | Scotland | France |
| Studies | Computer Science | Product Design | Mechanical Engineering | Electrical Power Engineering | Environmental Engineering |
| University | Lodz University of Technology | Univeristy of Antwerp | Tampere University of Applied Sciences | Glasgow Caledonian University | Unilasalle |
1.2 Motivation
Our team will focus on the 3D modeling of a bicycle probe. This probe, named GOairLight will ensure the cyclist the safety they need to ride from point A to B, and in the meanwhile, retrieve information about air quality. GOairLight can be split into GO - AIR - LIGHT. GO refers to the movement:
the probe will work only if the cyclist is moving. Air is the stream that passes through the device and contains (or not) air pollutants that will be assessed. Finally, the automated light system will help the rider feeling more secure, and the team wanted to amplify this feature in the name of the probe.
As we are all aware of air quality issues, especially in big cities. This is a good opportunity for all of us to work on that issue. The project
was chosen because all of the team members can contribute with their knowledge from different backgrounds (see Table 1). The project is in English. Meaning that we have to talk, write, and understand English. This is an opportunity for us to improve our English.
1.3 Problem
Nowadays we see a rise in the ecological awareness of people. We are more than ever conscious of the health problems caused by air pollution (see also Introduction below). We want to be more and more informed about our environment. However, currently, the most popular means of measuring air pollution is by stationary probes placed in certain parts of the city. Pollution maps created this way are insufficiently accurate. GOairLight can be a solution to have real-time data collection regarding air pollution in cities. More and more people want to move using a bike (see also Bike utilization in Europe) which can be relevant for a data collection probe. It is also extremely important for the user to feel safe n the bike. Even though cycling accidents are decreasing over the years, accidents related to cycles still occur, meaning that safety isn't 100 % ensured.
1.4 Objectives
The 2 main goals of GOairLight is to ensure the safety of the cyclist with an all-included device equipped with a front, sustainable energy provided light. This same device gets information about the air quality in the cyclist's environment. GOairLight aims in helping the cycling community on finding better - less polluted routes. We want the rider to be more conscious about their lifestyle.
1.5 Requirements
Functional requirements
- The prototype has to be a device that transforms a bicycle into a smart mobile probe
- A 3D model must be done to imitate the real-life conditions when using GOairLight
- Kinectic power alone must power the probe with the use of a dynamo
- The design must allow some elements to pass through (such as air), howeve,r block others including water
Limitations
- Maximum budget of 100.00 €
- Low-cost hardware solutions
- Open-source software
Technical Requirements
The probe must comply with the following european directives:
1.6 Functional Tests
To ensure that our product functions correctly, we decided on conducting several tests of both components and the software, as depicted in Table2
| Element | Purpose | Testing |
|---|---|---|
| Led light/lasers/turn signal button | Increasing the visibility of the user | Provide processor with test code for turning on all the lights and testing buttons |
| Arduino board | Make sure the control unit of the product is functional | Test code example |
| Sensors | Make sure the components are working | Test code example |
| Dynamo | To provide electricity to a device | Power a test diode |
| Accumulator | Make sure the energy is stored | Check if the device works when not provided with energy from dynamo |
| Application | Make sure the application is clear, legible and connects to the probe | Test the included functionalities and possible scenarios of use |
| Cloud | Make sure the data is transferred to cloud | Read data in the cloud |
| Bluetooth | Check if Bluetooth connection is working | Test the connection between device and application, send dummy data |
1.7 Project Planning
In our project, we use the Scrum methodology [1]. The main idea behind it is to break down work into single tasks that are then completed in a given time frame, called sprint. Sprint can last anywhere from a week to a month, however, we chose to use a one-week interval. The general expectations for the project and tasks to be completed are placed in the product backlog. Then tasks for each sprint are derived from those general ideas and placed in the sprint backlog. As the sprint progresses they are moved to an “in progress” section and finally the “done” section. Those tasks and workload division are established at the first meeting of each cycle. During the sprint, team members conduct short meetings to update on the state of their tasks and possibly discuss them. Then after each sprint, the team members meet to assess the completion of the tasks and the general state of the project.
To help us manage the scrum tasks, we use a Trello board [2] where each team member can easily look up or update their tasks during the sprint. The Figure1 shows how our Trello model looks like.

The Trello model has been changed during the middle of the project. It has been replaced by the tool Microsoft planner, as shown in the Figure 2.

1.8 Report Structure
The report is structured as (Table 3):
| Chapter | Name | Description |
|---|---|---|
| 1 | Introduction | General information about the team and the project |
| 2 | State of the Art | Market research on already existing solutions |
| 3 | Project Management | Overview of the different aspects of project execution |
| 4 | Marketing Plan | Analysis of the market the product will be entering |
| 5 | Eco-efficiency Measures for Sustainability | Means of achieving sustainability of the project |
| 6 | Ethical and Deontological Concerns | Ethical aspects of the project |
| 7 | Project Development | The technical description of the project execution and steps taken to complete the product |
| 8 | Conclusions | Discussion on the project results |
2. State of the Art
2.1 Introduction
A bicycle probe is a smart device used on a bicycle. The goal of GOairLight is to collect information about the air quality and in the meantime, keeping the rider safe.
Mobility is at the core challenges of the cities of today as it is a huge source of pollution and energy consumption. For all Europe, 31 % of the energy consumption is used for mobility, as stated by the European Environment Agency [3], against 30 % in 2008 [4]. The European Commission wants to put the focus on the clean and cheap urban transport: the bike. According to the European Commission, “half of all car trips are of less than five kilometers”. As a result, the Commission works on reinforcing the cycling aspects in the cities with the wish to offer more road safety for cyclists and reinforcing transport statistics [5].
Sustainable mobility like bicycles could help to deal with air pollution issues. Air pollution problems have been addressed since the ’70s and are seriously taken into account by the European Commission. The Air Quality Framework Directive 96/62/EC is the leading directive towards the reduction in the atmospheric pollutants. The air pollutants that have a limit value are the following: ozone (O3), particulate matter (PM10 and PM2.5), and nitrogen dioxide (NO2). Nowadays, the Ambient Air Quality Directive regulates the air quality of the European countries. The air quality legislation wants each country to divide the territory into smaller zones and agglomerations. The air quality in each of those zones must be assessed and disseminated to the public. If the measures do not match with the EU limitations, the Member States must prepare an air quality program to address the pollution [6].
The bicycle probe will collect information about pollution conditions in cities. The goal is then to transfer the data to a cloud so that the public can see the results. The bicycle probe could fit with the Ambient Air Quality Directive as it represents an interactive way to get data from the air quality.
The European Road Safety Observatory (ERSO) is in charge of gathering information on road safety around the European countries. In 2016, 25 600 people were killed in road accidents. 2000 of the casualties were cyclists, which represents 8 % of the total deaths. The countries with the highest percentage of casualties are the Netherlands (19 %), Denmark (15 %) and Germany (12 %). ERSO also investigated the age of the cyclists who died on the road: most of the accidents occur for cyclists aged between 12 and 17, and those between 65 to 70 years old. Cyclist's fatalities are more likely to occur between 14:00 to 18:00 from Monday to Friday and on Sunday from 16:00 to 20:00. That information is important so that we can see more clearly to which people the bicycle probe would be more interesting. The ERSO showed as well that 26 % of cyclist fatalities occurred when there was no or poor lighting. We can see that light signalization must be a core component to improve the cyclist’s safety. Furthermore, the studies show that the body parts injured were upper extremities, lower extremities, and the head [7].
2.2 Existing Solutions
We researched a wide variety of similar products available on the market. We started off looking at low-end products and finished off with the more expensive devices. Devices which included mapping were also looked at to ensure we had a unique bicycle probe. Here is the range of prices for the following categories :
- Affordable bike computers: from 23 € to 65 €
- High-end options: from 99 € to 219 €
- Special bike computers: from 50 € to 200 €
- Air pollution products creating maps: no relevant range of price available
2.2.1 Affordable cycling computer
A lot of different cycling computers already exist on the market. For most of those devices, they are capable of monitoring the speed such as the current speed, the average speed, or the maximum speed, and they have a time or a distance function as well.
Cycling computers are devices that the user positions on the handlebar of the bike to measure the performance on the move. Table 4 shows different already existing cycling computers.
| Name | Features | Price (€) | Picture |
|---|---|---|---|
| B'TWIN 500 WIRELESS CYCLOMETER – BLACK [8] | * Speed function : current, average, max speed * Distance function: ride distance and total distance * Time function : time and stopwatch * Other parameters: temperature, back-lit screen | 23 |  |
| BRYTON GPS CYCLOMETER BRYTON RIDER 15 [9] | * Direction: compass mode and Map mode * Connectivity function: Bluetooth technology * 30 real-time functions: duration, speed, distance, calories, pace, altitude, heart rate * Synchronization with Bryton app : training data | 58 |  |
| MSW Miniac 322 GPS Bike Computer GPS, Wireless, Black [10] | * Direction: GPS enabled * Speed function : current, average, max speed * Distance function: ride distance and total distance, altitude * Time function : time and stopwatch * Synchronization with an app for cycling: training data | 65 |  |
| CYCPLUS S1 Wireless BT & ANT+ Bike Bicycle Speed Sensor [11] | * Data feedback such as gradient will be shown, along with speed, distance and duration * Sleep mode will be activated when not in motion * Standby time: 300 days. | 21 |  |
| Cannondale Wheel Sensor [12] | * Speedometer and GPS sensors provide route and distance data * The probe provides an alert for the next service due * Compatible with the Cannondale app * Life of 900 hours. | 50 |  |
| RPM CADENCE [13] | * Cadence measurement * LED indicator lights * Bike Mount. Indoor spin compatibility * Bluetooth * Battery life: 1 year. | 39.99 |  |
2.2.2 High End Options
There are already a lot of bicycle probes available on the market. On the high-end spectrum, the devices are equipped with high-quality sensors and materials, but the prices show that as well. These probes are more targeted to fanatic cyclist and not the everyday person (see Table 5).
| Name | Features | Price (€) | Picture |
|---|---|---|---|
| Beeline [14] | * Two navigation modes * Worldwide coverage (Google Maps) * Ride tracking & sharing * GPX import *Automatic backlight for night rides * Lifetime app and firmware updates * App supports English, French, German, Japanese languages | 99 | 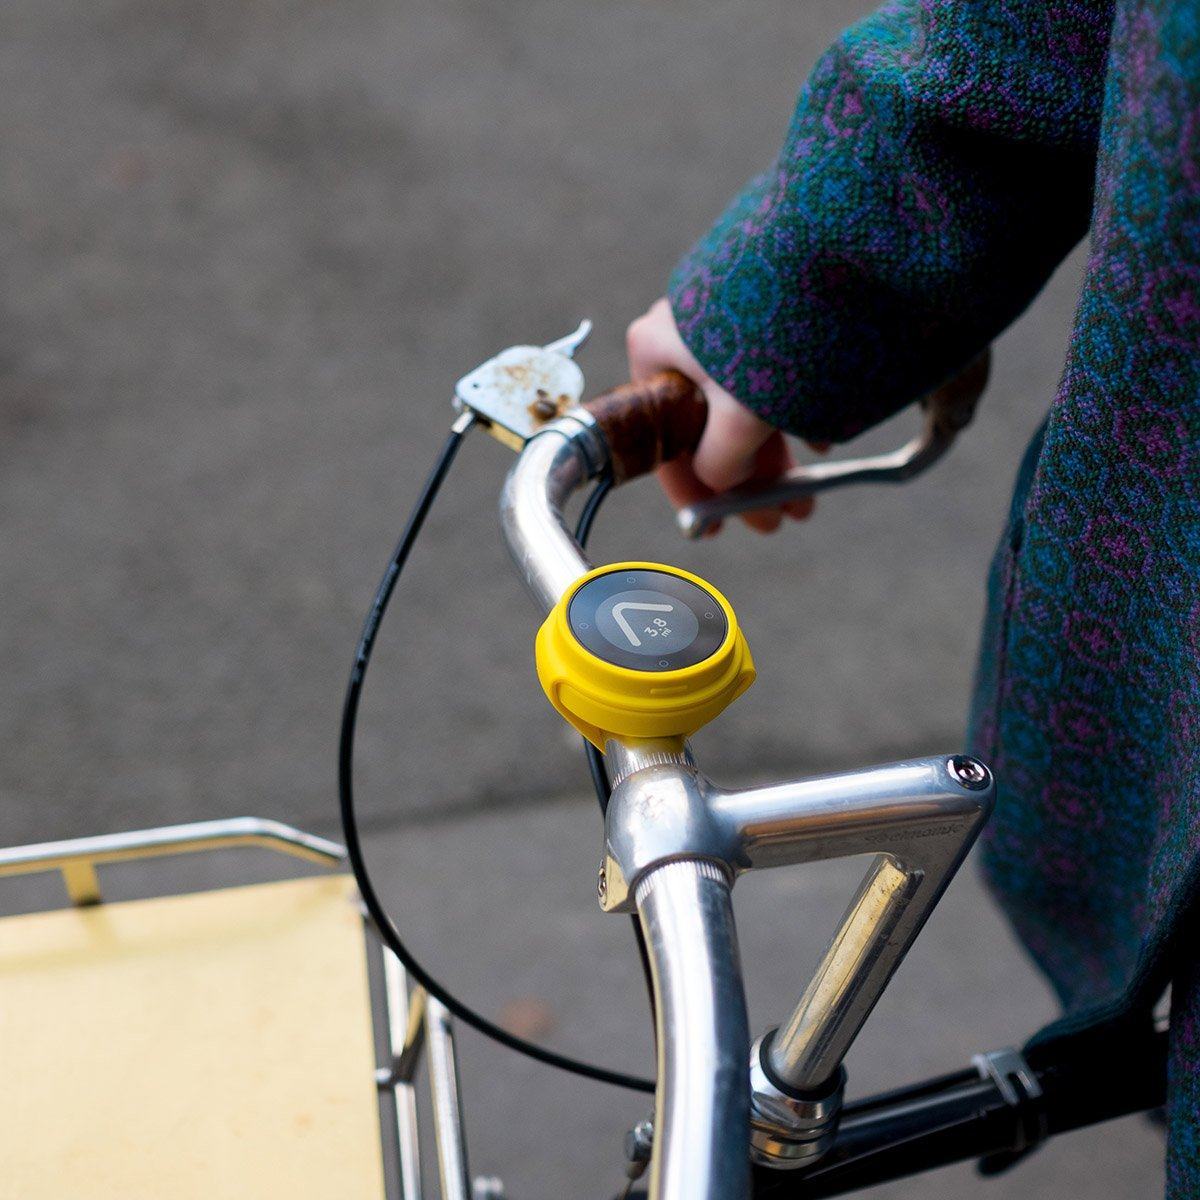 |
| Cobi [15] | * Smartphone App: Easy to read and 100 % optimised for use by cyclists * Owner activation lock * Bike voice navigation * Worldwide offline maps * Ultra-precise bike weather * Trip planning and touring and GPX route import (via Komoot) * Apple Health / Google Fit Integration * Charging mount: Integrated charging station and control unit * AmbiSense light system: Automated front and wireless rear lights (to German StVZO road use regulations) | 219 | 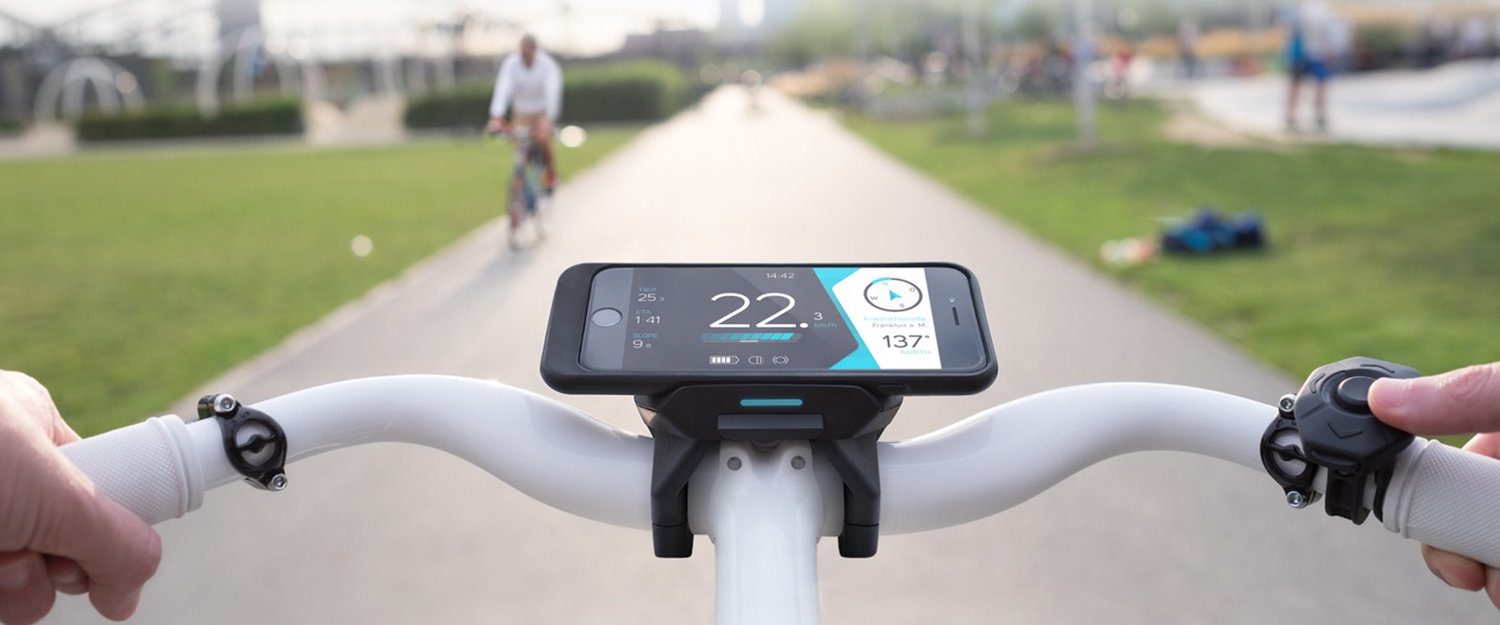 |
| Wraapit [16] | * Flexible: Smart snap wrap band dedicated to mount on sleeves or handlebars * Reliable: Long time battery life: about 7 days (regular usage) * Multifunction: Phone calls, Messages & e-mails, Music remote control * Azimuth navigation * Turn by turn navigation * Speedometer * Compass | - | 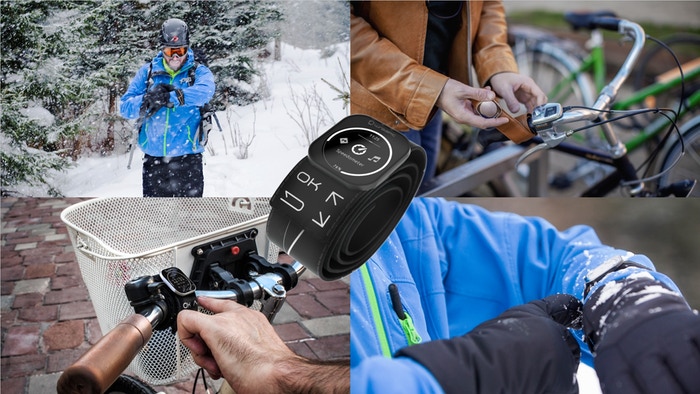 |
| Smarthalo 2 [17] | * Compas Navigation * Turn-by-turn Navigation * Automated Light * Anti-theft alarm * Fitness tracker * Customizable assistant * Wheather proof * Long battery life * Unique tool prevents teft | 159 |  |
| Bisecu [18] | * Smart Lock * Theft prevention with alarm * Bike sharing through application * Real-time riding data analysis * 6 months usable battery life * Speedometer | 169 |  |
| BH51 (Range) helmet [19] | * Hands-free operation \\* Smart Lighting * Fall Detection * SOS-Button * One-click answer to phone * PTT Walkie-Talkie * Voice navigation * Waterproof * Open speaker design | 158 |  |
2.2.3 Specials
In specials, you can find devices with more special features. Many of these products were found on a website called Indiegogo, so many of these products are using brand new designing and latest technology. Table 6 shows the already existing products.
| Name | Features | Price (€) | Picture |
|---|---|---|---|
| Speednite [20] | Turning indicator when tilting head Brake light SOS feature Handlebar remote | 129 |  |
| Raz Pro [21] | Brake light Road bump alert Light sensor and auto on/off | 50 |  |
| I LOCK IT GPS [22] | Automatic bike lock and unlock Anti-theft sensor and alarm Sharing bike without key Real-time alarm notification on your smartphone Live GPS-tracking | 200 |  |
| Garmin Varia™ RTL510 [23] | Visual and audible alerts to warn of vehicles approaching from behind | 200 |  |
2.2.4 Air pollution products creating maps
There are some air pollution products creating maps on the market. Some of them are gathered in Table 7.
| Name | Features | Price (€) | Picture |
|---|---|---|---|
| AirBliss+ [24] | is working on delivering a connected respiratory protection wearable where every wearer is protected against air pollution and provided real-time crowdsourced ambient pollution data * Navigate in a polluted area with the crowdsourced pollution map * Rewarded for making your city a better place | - |  |
| Airlib [25] | High-resolution urban air quality maps from automotive sensor data creating a groundbreaking air quality data analytics platform * Visualize and understand the pollution around, with unprecedented detail * Tells when not to go out * Recommends healthier routes | - |  |
| Plume Labs Flow 2 [26] | Personal air pollution sensor - Strapped to your bag, your bike, your belt, the real-time measurement of what’s in the air, anywhere. * Every urban area on the planet is now covered by real-time air quality data—as well as forecasts for the coming 24 hours * Fluid timeline * Detailed data * Easily compare air quality worldwide * Get the info you need * UX/UI overhaul | 159 |  |
2.3 Conclusion
The market research shows that there are a lot of applications dedicated to bikes, with a broad range of different features. Some of the most basic being speed, temperature, health parameters sensors along with at least some form of navigation and in some cases an application dedicated to the device. More advanced products feature automated lights, weather forecasts, known already from some car products – handless phone features handling, along with some anti-theft safeguards. We can see that there is also an entire market dedicated to highly specialized devices tailored more to bikes than general use. In this case, possibilities are endless, however, the ones we found include fall and pothole detection, SOS buttons, brake lights, and indicators controlled by head movements.
Another market we investigated were products that gave information on air quality. We found applications offering both were able to rely on users to provide pollution maps of the city. Most of those solutions included an application to displayed the data gathered. While there are many solutions in this department already existing, none of them are dedicated solely for bikes, therefore they have no added benefits whatsoever.
Taking all those factors into consideration, we can say that while there are a lot of solutions for bikes, we failed to find one that would combine active measurement of air quality during the ride with bike specialized safety features that would encourage the user to engage with the device daily. We are aware that this sole functionality might not be enough to attract users. Since we are very concerned with general safety, we thought that automatic lights could be a good idea to implement along with the pollution sensors. After carefully considering the market, we deemed that while there are already light sensor-controlled and indicator lights, we failed to find any eco-friendly alternatives.
Having defined our end goal, we now could concentrate on the path to achieve it. That being said, the next chapter concerns Project Management – the organizational “how” of our journey.
3. Project Management
In this chapter, we will provide an overview of our project management methods and analysis of many different aspects connected to managing people, resources, costs, risks and time.
3.1 Scope
Product scope is defined as the functions and features that characterize a product or a service. Project scope, on the other hand, is the work that must be done to deliver a product according to the product's scope (required functions and features) [27].
We created the following Work Breakdown Structure (WBS) as shown in Figure 3. Where we have six different stages:
- Proposal
- Design
- Interim
- Executive
- Testing
- Final

3.2 Time
In this project, we have limited time so we had to make Gantt Chart help us organize our time. We created our Gantt Chart Figure 4 using given deadlines. We created our first version of the Gantt Chart early and kept updating it (see Figure 4). Gantt Chart changed a bit because of COVID-19, for example, we didn't build a prototype, because it was impossible.


3.3 Cost
This chapter helps the reader with a better understanding of how much the whole project will cost regarding the final product cost as well as the working cost.
3.3.1 Material costs calculations
The following Table 8 provides information about the cost of components.
| N° | Item | Part of the device | Provider | Cost (per unit) (€) | Quantity | Total cost for the prototype (€) |
|---|---|---|---|---|---|---|
| 1 | AXA HR Traction Power Control Dynamo | Fitted to front wheel of bicycle | Bike-Discount | 16.53 | 1 | 28.50 |
| 2 | LADDA Rechargeable battery, HR6 AA 1.2 - 1.5V | Inside main casing | IKEA | 1.56 | 4 | 6.24 |
| 3 | 1A Step-up (Boost) Converter | Between dynamo and battery connection | Hobby Components | 2.26 | 1 | 2.26 |
| 4 | SSC Seoul P4 (U-bin) LED emitter | Front of main casing | FASTTECH | 0.75 | 3 | 2.26 |
| 5 | 4 x 1.5V battery box (RS PRO AA PCB Battery Holder) | Inside main casing | RS Components | 0.66 | 1 | 0.66 |
| 6 | 1N4007 diodes (bridge rectifier) | Inside main casing | RS Components | 0.06 | 4 | 0.24 |
| 7 | Electrical wire (0.5mm) | Inside main casing and connection from dynamo to battery | RS Components | 0.33 | 1 (meter) | 0.33 |
| 8 | Arduino Nano BLE Sense | Inside the main casing | Arduino store | 27.00 | 1 | 32.40 |
| 9 | Adafruit CCS811 Air Quality Sensor | Inside the main casing | Adafruit | 19.95 | 1 | 19.95 |
| 10 | 5 Ohm resistor | Inside the main casing | Banggood | 0.28 | 10 | 2.75 |
| 11 | Printing (PP) | Front shield, main device, mounting piece | ISEP formfutura | 14.24 | 1 | 14.24 |
| 12 | Frosted Acrylic 3mm | Light cover | cutmyplastic | 0.62 | 1 | 0.62 |
| 13 | Inner hexagon FLAT DIN 6912 | Mounting piece | Ebay | 0.47 | 3 | 2.36 |
| TOTAL (€) | 112,81 | |||||
Due to the current COVID-19 pandemic, our components have not been able to be sourced locally in Portugal as the majority of the team members have returned home. However, components would be bought from local suppliers near Porto in we had remained in Portugal and was able to build the prototype physically.
3.3.2 Working cost calculations
The total cost of the production of our bicycle probe is 112,81 €. This price includes all of the components and materials used, however, this does not include the price of injection molding. Injection molding varies on the size of the batch we decide to order amongst other things. So by comparing similar-sized products to the cost of their injection molding with a batch size of 1000, it has been estimated that this would add another 30 € to the cost of our production. This brings us to a price just short of 160 €.
3.4 Quality
Quality metrics are the key components of an effective quality management plan as it is used to provide the customer with an effective final product. It must help in answering the needs of the customer with acceptable performances. Metrics should be clear, measurables, controllable, and reportable. The limits or thresholds will be assessed in this section. Based on customer product requirements and deliverables, the following metrics will be assessed:
- Data quality
- Service quality
- Material quality
- Product quality
- Limits and thresholds
3.4.1 Quality metrics
As an innovative device, GOairLight must ensure the customers with good information and a good quality product.
Data quality : It is important to provide effective information to the customer. GOairLight is based on the sharing of information throughout the community. This is a fundamental requirement to provide customers with good information and data. Sensible data will be recorded, we have to make sure the sensors are well-calibrated. A light intensity sensor is integrated into the whole system.
Service quality : The service quality will be ensured via the GOairLight app. The results from GOairLight sensors will be shown with the Android application, where the user could see the air quality data, recorded on an interactive map. We would like this application to give as well information about the better routes to take (instead of the polluted routes), and the humidity. Lights will turn on depending on the light intensity.
Material quality : We must make sure every component arrives in good shape (no outside/inside damages). They must comply with EU directives on health and low voltage.
Product quality : The general product quality is the most important part of the quality section. We have to make sure that the final product is well designed to fit on every bike, otherwise, we could lose a market segment.
3.4.2 Limits and thresholds
Due to the circumstances of COVID-19, no physical prototype will be built. No physical tests will be done neither meaning that we can't do the performance metrics. This is a big problem regarding the quality of the final product.
3.5 People
Stakeholders are a very crucial part of each project. Their involvement can make or break the project, therefore it is crucial to identify them beforehand to properly manage them during the execution. In our project, first and foremost, the key stakeholders are team members and supervisors. Each of them has a different investment in the basic tasks the project is comprised of. Their involvement can be observed in the following responsibility assignment matrix (Table 9), where:
- R – Responsible – the person that is in charge of completing the task
- A – Accountable - the person responsible for decisions about the task and making sure its final outcome meets requirements
- C – Consulted – The person whose opinions influence the execution of the task
- I - informed – The person who has no direct influence on the task but is being updated on its progression
| Task/Person | Kaan | Melissa | Zuzanna | Juho | Logan | Julia* | Supervisors |
|---|---|---|---|---|---|---|---|
| Task identification and allocation | R | R | R | R | R | - | C, I |
| Gantt chart | A | A | A | R | A | A | C, I |
| State of art | R | R | R | R | R | R | C, I |
| Component research | I | I | R | R | R | - | C, I |
| Design schematics | R | C | C | C | C | - | C, I |
| 3D model | R | C | C | C | C | - | C, I |
| Black box diagram | R | R | C | C | C | - | C, I |
| Technical schematics | I | I | C | I | R | - | C, I |
| Project management | I | R, A | R | R | R | - | C, I |
| Marketing plan | C | R, A | C | A | C | - | C, I |
| Eco-efficiency and sustainability | I | R | I | I | I | - | C, I |
| Ethics and deontology | I | I | R | I | I | - | C, I |
| Interim presentation | R | R | R | R | R | - | C, I |
| Interim report | R | R | R | R | R | - | C, I |
| Arduino software | I | I | R | I | I | - | C, I |
| Application | C | I | R | R | I | - | C, I |
| IoT platform | I | I | R | R | I | - | C, I |
| Final 3D model | R | C | C | C | C | - | C, I |
| Hardware simulation? | C | I | A | I | A | - | C, I |
| Testing software | C | I | R | I | C | - | C, I |
| Final report | R | R, A | R | R | R | - | C, I |
| Leaflet | I | R | I | I | I | - | C, I |
| Packaging solution | R | C | C | R | C | - | C, I |
| Poster | I | R | I | I | I | - | C, I |
| Manual | I | I | I | R | I | - | C, I |
| Final presentation | R | R | R | R | R | - | C, I |
| Paper | I | R | R | I | C | - | C, I |
| Video | R | I | I | I | I | - | C, I |
* Unfortunately Julia has left our project, however, she still completed several tasks at the beginning of it.
For these tasks to be completed and for them to fit into the entire project properly, good communication between the team members themselves and the team and supervisors is needed, which we will discuss in the next subchapter.
3.6 Communications
For a project, especially one conducted remotely like ours, communication is one of the most crucial aspects. Each team member needs to be aware of the overall situation of the project, their responsibilities, and whether another member might need help with their task. Even the slightest misunderstanding might, in the long run, turn out to be detrimental to the project as a whole.
Another crucial aspect is communication the one with the supervisors. It is required to assure that the project is going in the correct direction and to obtain help resolving issues we are not equipped to deal with on our own.
In the following table (Table 10), we can see different types of communication utilized in the project:
| Type | Medium | Schedule | Participants | Objectives |
|---|---|---|---|---|
| Project meeting | Microsoft Teams | Every Thursday | Team Supervisors | Updating the supervisors on the progress, resolving issues and seeking guidance, receiving feedback on completed tasks |
| Project planning | Microsoft Teams / Zoom | Beginning of every sprint | Team | Set tasks for the new sprint cycle |
| Team meetings | Microsoft Teams / Zoom / Whatsapp | When needed | Team | Discuss the current tasks and ideas, help each other |
| Briefing meetings | Microsoft Teams / Zoom | Thursday after project meeting | Team | Discuss the feedback from supervisors, reorganize project accordingly |
| Supervisor consultation | Microsoft Teams / Zoom /e-mail | When needed / during class | Team Supervisor | Discuss problems in specific field |
Due to the circumstances beyond our control, we had to resign from face to face meetings, however, at the beginning of the project, all of the communication via Microsoft Teams or Zoom was done in person.
This was one of the risks we took up when starting this project – the possibility of outside influences on the project completion, on which we shall elaborate more in the Risks subchapter.
3.7 Risk
Undertaking any kind of project, or more accurately, investing time and money in it unavoidably comes with risks, being a possibility of something going unexpectedly wrong in the project. To have a chance to counteract them, risks need to be assessed and identified at the beginning of the project.
Risks can have varying impacts on the project as well as probability; both of those factors make up how severe the problem is when initially assessing it.
In the following table (Table 11), we have listed the possible risks connected to our project:
| Key | Risk | Cause | Detection | Impact | Probability | Resolution |
|---|---|---|---|---|---|---|
| Internal risks | ||||||
| 1 | Conflict between members | Disagreement, Personal problems between members | Difficult cooperation | High | Low | Team members not involved in conflict mediating, in extreme case reassigning tasks not to force the parties to directly work together |
| 2 | Member leaving project | Personal matters, health issues | Information from the member | High | Average | Reassigning the missing member’s tasks |
| 3 | Insufficient knowledge | Lack of specialists in a particular field in the team, lack of experience | Problem with completing a task | Average | Average | Avoid setting tasks that might exceed our limits. Not setting unrealistic goals, research possible different solutions |
| External risks | ||||||
| 4 | National/international emergency | Epidemic, natural catastrophe, etc. | News alerts | Very high | Average | Proceed with the project to the best of our capabilities in the situation |
| 5 | Materials being out of stock | Oversight when choosing materials, changing market situation | Not being able to buy component | Average | Low | Enquire the supplier about product availability, change the component to a similar one available |
| 6 | Faulty components | Manufacturer’s mistake | Product not working properly | High | Low | Test the components at acquisition, ask the manufacturer for refund/ replacement |
| Technical risks | ||||||
| 7 | Software or hardware not working properly | Lack of tests in all execution stages | Later testing, product not working on final presentation | Very high | Very low | Thorough testing while the project is still in progress |
| 8 | Components do not fit together | Carelessness | Problems during assembly of the product | High | Low | Careful design and selection of components beforehand |
| 9 | Data theft | Insufficient encryption when transferring data to cloud | Hard to detect unless exposed | High | Average | Limiting sensitive data being sent to the cloud, ensure the data is properly encrypted |
| 10 | Air access design not waterproof | Insufficient humidity protection | Electronics malfunction | High | Low | Testing the design before placing the electronics |
These aforementioned risks can be compiled into the following risk matrix that shows which risks are more severe:

As we can see from this table, the most crucial risks for our project would be a team member leaving, an emergency of a high caliber, and possibly us having insufficient knowledge to complete the project. While the first two are something mostly beyond our control in the current situation and we can only work on how to minimize their impact, we can only do our best to avoid the third one, by being resourceful with our current knowledge and seeking help from supervisors when needed.
Having the risks analysed and defined, we can move on to managing the procurement strategies.
3.8 Procurement
The procurement strategy that we adopted was mainly focused and relied, on the common sense of the team. Knowing our budget of 100.00 €, we had to carefully design and develop our bicycle probe to acquire our materials and components for under the set budget.
When sourcing our products, they needed to be found at a cost-effective price. During the task of searching for materials and components, we had to find different versions of the same component and then compare each one. This was done to assure the best quality and reasonably priced product would be incorporated into our probe. Where possible we also looked for providers with either free delivery or Porto / Portuguese based company.
We made sure that our total procurement price will be less than the price of our bicycle probe. This ensures a profit is made for GoairLight.
Our main thoughts whilst procuring components and materials:
- Low cost yet high quality
- Reliably and legitimately sourced
- Compatibility with the rest of our bicycle probe
3.9 Stakeholders Management
As already stated in the subchapter 3.5 stakeholders are crucial to the very existence of a Project. Having this in mind, one needs to be aware of each of their roles, investment in the project, and their influence on it. Knowing all those factors we can then decide how to manage each group so that they are satisfied and continue supporting our undertaking.
Firstly we need to identify key roles in the project and people connected to them to be able to assess their interest and power over the project. To analyse those factors we used the following Table 12
| Key | Stakeholder | Role | Power (1-5) | Interest (1-5) |
|---|---|---|---|---|
| A | Team | Execution of the project | 5 | 5 |
| B | Supervisors | Controlling | 3 | 5 |
| C | Suppliers | Supplying materials for the project | 2 | 1 |
| D | Customers | Buying and using the product | 2 | 3 |
| E | Sponsors | Supporting the project | 2 | 5 |
| F | Competitors | Competing | 1 | 1 |
| G | ISEP | Sponsor | 5 | 2 |
Having gathered this information, we created a stakeholder analysis matrix shown in Figure6, to help us visualize better our stakeholders and decide how we should manage them during the project.

- Manage closely - As we can see from the matrix, our main priorities are team members and the supervisors, since they have the most power and interest. As established in previous chapters, they are the key stakeholders. Other than the team, we will engage this group by regular updates and consultations with them.
- Keep satisfied – Those are the high power stakeholders who hold no particular interest in the project. We should exercise caution in interacting with those stakeholders and bring in the best possible results, to keep them satisfied. In our project, this role fits the ISEP.
- Keep informed – this is the group that has little power over the project. However they do have a high interest in it and it is in our best interest to keep them informed of the work progress, for them not to lose that interest in our final product. In our project, this can both be said about customers and the sponsors.
- Monitor – these are groups who have very little interest and power over the project. They are related to it in some way and need to be watched for their indirect influence. In our case, this would be component suppliers, whose only impact on the project is the quality of their services and our competitors, whose products rival ours and might affect our sales.
3.10 Sprint Outcomes
This part will go through the Global Sprint Plan, the Project Backlog, and the Sprint Plan of the project. This chapter will help the reader understand how our work was divided through time, how we deal with the different tasks, and how much time was allocated for each task. The Sprint planning takes part in the SCRUM methodology and includes the work that has to be performed in the Sprint. The following Table 13 presents our Sprint Planning:
| Sprint n° | Lasts | Exact dates |
|---|---|---|
| 1 | Week 10 | 03.02.20 - 03.06.20 |
| 2 | Week 11 | 03.09.20 - 03.13.20 |
| 3 | Week 12 | 03.16.20 - 03.20.20 |
| 4 | Week 13 | 03.23.20 - 03.27.20 |
| 5 | Week 14 | 03.30.20 - 04.03.20 |
| Easter Break | ||
| 6 | Week 16 | 04.13.20 - 04.17.20 |
| 7 | Week 17 | 04.20.20 - 04.24.20 |
| 8 | Week 18 | 04.27.20 - 05.01.20 |
| International Student Week | ||
| 9 | Week 20 | 05.11.20 - 05.15.20 |
| 10 | Week 21 | 05.18.20 - 05.22.20 |
| 11 | Week 22 | 05.25.20 - 05.29.20 |
| 12 | Week 23 | 06.01.20 - 06.05.20 |
| 13 | Week 24 | 06.08.20 - 06.12.20 |
| 14 | Week 25 | 06.15.20 - 06.19.20 |
| 15 | Week 26 | 06.22.20 - 06.26.20 |
To see the tasks we have to complete for the week to come, we were using in the first weeks a Trello model as you can see on Our Trello model. The Trello model is an interesting tool because we have a clear view of what needs to be done, who is doing what, what is already done, etc. This application allows us to set the deadlines for each of the tasks and a colour code makes it easier to see the oncoming deadlines. On the will of the teacher, we moved through the Microsoft planner application. This tool looks like the Trello model and allows us to gather all the information on the same application (Outlook application). You can have a look at it on Microsoft Planner.
| Sprint n° | Task | Time required (days) | Assignee |
|---|---|---|---|
| Sprint Plan n°1 : 03.02.20 - 03.06.20 | |||
| 1 | Prepare the meeting with the supervisors | 0.1 | Team |
| 2 | CHAP 2: State of the art introduction | 1 | Mélissa |
| 3 | CHAP 2: Research on affordable bike computer | 1 | Logan, Mélissa |
| 4 | CHAP 2: Research on high-end options | 1 | Julia, Kaan |
| 5 | CHAP 2: Research on specials | 1 | Juho |
| 6 | CHAP 2: Conclusion | 1 | Zuzanna |
| Sprint Plan n°2 : 03.09.20 - 03.13.20 | |||
| 1 | Prepare the meeting with the supervisors | 0.1 | Team |
| 2 | Researches on Bluetooth connection | 2 | Zuzanna Juho, Logan |
| 3 | Researches on processors | 2 | Zuzanna, Juho |
| 4 | Researches on dynamo | 2 | Logan |
| 5 | Researches on marketing segmentation | 5 | Julia, Mélissa |
| 6 | Uploading of CHAP 2 on the wiki | 1 | Team |
| 7 | First structural drafts | 3 | Kaan, Juho |
| 8 | First black-box diagram | 1 | Mélissa |
| 9 | Discussion on the side and back lights | 2 | Team |
| Sprint Plan n°3 : 03.16.20 - 03.20.20 | |||
| 1 | Meeting preparation with the supervisors | 1 | Team |
| 2 | Leaflet drafts | 1 | Mélissa |
| 3 | Name and Logo discussion | 2 | Team |
| 4 | Structural drafts upload on wiki and discussion | 1 | Kaan |
| 5 | Choose of dynamo and discussion on the power | 1 | Logan, Juho Zuzanna |
| 6 | Discussion on the abortion of the side lights | 1 | Team |
| 7 | Moodboard drafts | 1 | Kaan |
| Sprint Plan n°4 : 03.23.20 - 03.27.20 | |||
| 1 | Final logo and name | 2 | Kaan, Team |
| 2 | Choose of the processor | 2 | Zuzanna |
| 3 | Final black-box diagram | 1 | Kaan, Mélissa |
| 4 | Final sketches | 1 | Kaan |
| 5 | First schematics | 3 | Logan |
| 6 | First list of materials and components | 1 | Logan, Juho, Zuzanna |
| 7 | Modboard | 1 | Kaan |
| 8 | Leaflet presentation | 0.1 | Mélissa |
| Sprint Plan n°5 : 03.30.20 - 04.03.20 | |||
| 1 | CHAP 5 : sustainability | 2 | Mélissa |
| 2 | Final list of materials uploaded on wiki | 1 | Logan, Juho, Zuzanna |
| 3 | Choice of ethics subject | 0.1 | Mélissa |
| Sprint Plan n°6 : 04.13.20 - 04.17.20 | |||
| 1 | CHAP 4 : marketing | 4 | Mélissa |
| 2 | 3D modeling | 5 | Kaan |
| 3 | CHAP 6 : Ethics | 2 | Zuzanna |
| Sprint Plan n°7 : 04.20.20 - 04.24.20 | |||
| 1 | Marketing and ethics chapters reviewed | 2 | Mélissa, Zuzanna, Juho |
| 2 | 3D model video first edition | 2 | Kaan |
| 3 | List of material reviewed | 4 | Zuzanna, Juho, Logan |
| 4 | Interim report review | 1 | Team |
| 5 | Finishing of chapter 3 | 1 | Mélissa |
| 6 | Prepare the meeting with the supervisors | 0.1 | Team |
| 7 | Addition of back light reconsidered | 0.1 | Team |
| Sprint Plan n°8 : 04.27.20 - 05.01.20 | |||
| 1 | Paper: state of the art and problem statement | 2 | Mélissa, Juho, Zuzanna Kaan |
| 2 | 3D model video | 5 | Kaan |
| 3 | Complete sprint outcomes | 1 | Mélissa |
| 4 | Prepare the meeting with the supervisors | 0.2 | Team |
| 5 | Start of thinking about packaging solution | 1 | Team |
| Sprint Plan n°8 bis : 05.04.20 - 05.08.20 (International Student Week) | |||
| 1 | Marketing and ethics chapters review | 2 | Méissa, Zuzanna, Juho |
| 2 | Packaging solution proposal | 1 | Team |
| 3 | Sustainability chapter review | 0.5 | Mélissa |
| 4 | List of components review | 2 | Team |
| 5 | UML schematic of application | 0.25 | Zuzanna |
| Sprint Plan n°9 : 05.11.20 - 05.15.20 | |||
| 1 | Reasearches on packaging solution | 2 | Team |
| 2 | Start of the paper: problem statement and state of the art | 1 | Mélissa, Zuzanna, Juho |
| 3 | Power budget calculation | 0.5 | Logan |
| 4 | Application internal storage | 2 | Zuzanna |
| 5 | Application bluetooth connection | 1 | Zuzanna |
| Sprint Plan n°10 : 05.18.20 - 05.22.20 | |||
| 1 | Start of the poster | 2 | Mélissa |
| 2 | Paper: parts on state of the art, marketing, ethics, sustainability | 2 | Mélissa |
| 3 | Packaging solution design | 3 | Kaan |
| 4 | Packaging solution material researches | 1 | Juho |
| 5 | Applicaton cloud storage | 2 | Zuzanna |
| 6 | App mockup | 0.25 | Zuzanna |
| Sprint Plan n°11 : 05.25.20 - 05.29.20 | |||
| 1 | Finnishing of the poster | 1 | Mélissa |
| 2 | Paper: parts on concept, design, project and personal outcomes | 2 | Mélissa |
| 3 | Paper: application development, simulation and tests, discussion | 2 | Zuzanna |
| 4 | Paper review | 0.5 | Logan |
| 5 | Technical drawings | 0.5 | Kaan |
| 6 | Apllication authentication | 1 | Zuzanna |
| Sprint Plan n°12 : 06.01.20 - 06.05.20 | |||
| 1 | Final Video | 2 | Kaan |
| 2 | Manual | 2 | Juho |
| 3 | Final review of the report | 2 | Team |
3.11 Sprint Evaluations
The sprint plans are made for each of the weeks the project is running. The team needs to have a clear overview of the tasks that are done each week. A weekly meeting is being held on Wednesday to see if all the tasks of the previous week have been completed, or if we can make any improvement on our product or the different chapters. We can then analyse where the mistakes were and how to improve the way we work. The Table 15 shows the summaries of each sprint, through the positive and negative points.
| Sprint n° | Lasts | Number of tasks completed | Tasks not completed | Reason |
|---|---|---|---|---|
| 1 | 03.02.20 - 03.06.20 | 5 out of 6 | Conclusion | Conclusion needs to have all the other information, and was completed on Sprint n°2 |
| 2 | 03.09.20 - 03.13.20 | 6 / 6 | - | - |
| 3 | 03.16.20 - 03.20.20 | 4 / 7 | Logo, dynamo, moodboard | Logo's drafts were not good enough, the problem of the power made it difficult to give statement for this sprint, the moodboard needs to have clear ideas of the whole product |
| 4 | 03.23.20 - 03.27.20 | 8 / 8 | - | - |
| 5 | 03.30.20 - 04.03.20 | 3 / 3 | - | - |
| 6 | 04.13.20 - 04.17.20 | 2 / 3 | Marketing chapter | Marketing chapter not completed due to delays in redaction |
| 7 | 04.20.20 - 04.24.20 | 4 / 7 | Marketing and ethics chapters review, list of material review, interim report review | Marketing and ethics chapters need to be reviewed by the teacher, delays in reviewing the list of materials and the whole report |
| 8 | 04.27.20 - 05.01.20 | 5 / 5 | - | - |
| 8 bis | 05.04.20 - 05.08.20 | 3 / 4 | Packaging solution proposal | Not enough good and viable packaging solutions were proposed |
| 9 | 05.11.20 - 05.15.20 | 3 / 3 | - | - |
| 10 | 05.18.20 - 05.22.20 | 4 / 6 | Start of the poster, paper | The poster wasn't finished in time due to constant improvement, the paper redaction needed to be constantly reviewed to comply with the restrictions |
| 11 | 05.25.20 - 05.29.20 | 6 / 6 | - | - |
| 12 | 06.01.20 - 06.05.20 | 3 / 3 | - | - |
3.12 Conclusion
This chapter allowed our team to clarify the management strategies we will be using throughout the project. We set fixed time constraints, which will allow us to complete all tasks in a timely manner. Cost calculation made us more aware of the limits and restrictions on our finances. We identified our stakeholders and decided on clear guidelines on how to treat each group to maximize overall satisfaction from the project. Risk assessment made us consider all the possible situations we may find ourselves in and gave us ideas on how to avoid those scenarios, or deal with them when they arise. We clarified our communication methods along with a schedule for them. Finally, we analyzed our sprint cycles and drew conclusions on how to improve them. Our work efficiency benefited greatly from that analysis and gave us insight on how to proceed in the future.
Having gathered information on the management aspect, we could move on to thinking about how to properly enter the market with our product. Hence next chapter – Marketing Plan.
4. Marketing Plan
4.1 Introduction
The role of marketing in an organization is to create strong profitable relationships with the customers. The role of the marketer is to choose the right people to target, to catch interesting market opportunities, to communicate on which products or services to offer, and at what price or to decide which distribution system to use. Marketers create the link between the firm and the market. The marketing program can be summarized in how the company attracts, retains, and grows its customers [28]. According to Investopedia, a market is “a place where two parties can gather to facilitate the exchange of goods and services” [29] . It is represented by customers, competitors, and trade.
This chapter will explore the marketing management of GOairLight, make a SWOT analysis, will define the strategic objectives of the product, will define the segmentation of the project, it's positioning on the market, and it's budget.
4.2 Marketing analysis
The marketing management can be divided into 4 steps, according to An introductory note on marketing management, Michael Pearce (2008) [30] :
- Define the marketing challenges
- Identify attractive market opportunities
- Select a primary target market
- Decide on the product offering
4.2.1 Marketing challenges
GOairLight main goal is the ensure the security of the cyclist by helping him with an automatic light system, and also to provide information to the cyclists’ community by gathering air quality information on a mutual cloud. The challenge here is to create a strong functional value proposition because GOairLight product takes part in an already existing solution (see section 2.2 Existing solutions). The aim of the marketing management here is to get potential customers to know about the benefits of our product in terms of health and security. We also want to raise awareness of the customers regarding air quality issues as well as road safety. By raising information about those two points, we can create the need for the customer to have the GOairLight device. We need to put focus on the creation of emotional branding.
4.2.2 Attractive market opportunities
By identifying attractive market opportunities means identifying what the marketers could do, even before the product is made. As already explained in the previous part, we know that a market already exists in the fields of computer bikes and air pollution interactive maps. The project GOairLight is to combine those two existing solutions to provide the customers with more information and an all-included device. Analyzing opportunities must be done following the 4 steps:
- Environmental scanning: can be done following the political development, economic issues, social trends and technology developments, legal and environmental forces – also called PESTLE analysis [31] . It can help marketers with a better understanding of the external factors which can impact strategy and influence business decisions. The Figure 7 shows the 6 different factors and the elements that can influence the environment.

The GOairLight PESTLE analysis is shown in Figure 8. This PESTLE analysis is an interesting tool to see the general atmosphere in which our product is emerging. In that situation of COVID-19, it is mainly the economic factor that will be affected: the buying power is decreasing in Europe due to the economic breakdown and low business activity. This can seriously affect our future sales, as people are more willing to buythe necessary goods than non-essential products. However and regarding laws, during the “Europe lockdown” the bike stores in most of the European countries were still open [32], [33] as they are seen as social distancing tools against the virus. As for China, the coronavirus crisis leads to an increase in the sales of the bikes [34].

1 You can have a look here: Liability, ethics
- Competitive analysis: can be done via a competitive matrix, it helps to answer the question: Who else is offering something similar to what we are planning to offer? The competitive analysis shows the differences between marketing programs as well as marketing performances. The Table 16 shows the differences between the GOairLight sensor and other similar products.
| Cannondale Wheel sensor's Strengths (+) and Weaknesses (-) | Smarthalo 2 sensor’s Strenghts (+) and Weaknesses (-) | Cobi app’s Strenghts (+) and Weaknesses (-) | GOairLight sensor’s Strenghts (+) and Weaknesses (-) | |
|---|---|---|---|---|
| Target market(s) | Non-leisure cyclists only: restrictive (-) | Bike delivery companies (+), upscale, modern class | Active people, upscale, modern working people | Active people, upscale, modern working people, elderly people, city bikes (+) |
| Product | * Automatic wheel sensor (+) * Connectivity with Cannondale app (+) * Less modern and useful device (-) * Least functionalities (-) | * Modern design (+) * Improved vision at night (+) * Routes custom-made for cyclists GPS (+) * Parked bike indicator (+) * Anti-theft alarm system (+) | * GPS and weather datas (+) * Automated light system (+) * Anti-theft alarm system (+) * Charging mount (+) * Advertising from the brand BOSCH (+) | * Fits on every bike (+) * Bluetooth connection with an app (+) * Unique combination (light, air quality sensor and dynamo) (+) * GPS (+) * Non anti-theft alarm system (-) |
| Price | Lowest available retail price (+) | High retail price (-) | Higher retail price (-) | Unknown retail price (?) |
| Place | Online shop: less advertising (-) but with online retailers (+) | Online shop: less advertising (-) | Same as for Smarthalo2 | Same as for Smarthalo2 |
| Promotion | * Facebook and Instagram up to date page (+) * Modern website (+) | Same as Cannondale | * Active on Instagram (+) but not on Facebook(-) * Modern website (+) | * Social networks: young population of viewers (+) * Hard to get known (-) |
| (Potential) Competitive barriers | Inferior product (-) | Superior product (+), a lot of functionalities (+) | Complete product (+), is part of BOSCH company (+) | Medium product (-),a huge community must use it to see the effects (-), creation of a community system (+) |
The competitive differentiation seeks to exploit deficiencies in competitive products or prices that could matter to the customer. The Table 16 can help the reader to better understand the differences between similar products. We can see that GOairLight is located quite in the middle between the Cannondale wheel sensor which is a basic sensor without a lot of functionalities (speed, distance, time) but with a connected app, and two high-tech devices like Smarthalo 2 and Cobi app, that are used to help the cyclist with environmental information (GPS, weather, alarms) and security functions like automated lights. Our product will have one big advantage compared to the others: it will be at the core of a huge community system thanks to the air pollution sensor.
- Customer analysis: is used to make a better understanding of the end-users, buyers, and intermediate buyers/sellers. As already mentioned, the GOairLight sensor must be placed on a bike, which means the customer must have a bicycle or at least have the money to buy one (GOairLight can be a motivation for someone to start moving using a bike!). It is also mandatory for the user to have a smartphone to use the GOairLight app. From a general point of view, we would like to target each of the bike user groups, which means teenagers, workers, commuters, or elderly people. Groups of customers are known as segments which will be discussed in section 4.5: Segmentation.
- Self-analysis: corresponds to the analysis of strengths, weaknesses, opportunities, and threats (see SWOT analysis).
4.2.3 Primary target market
The primary target market is the segment of the marketplace a company is willing to have the best chance to sell [36] . To know our target market, we need to know worldwide conditions related to the use of bikes, the willingness of people to have a smartphone, and their willingness to buy GOairLight regarding GDP.
4.2.3.1 Countries GDP
To target the most willingness-to-pay population, it is important to see the regions with most higher growth domestic product (GDP) per capita. According to the World Bank, the countries with the higher GDP are the ones with the deep blue color inside, as shown in the figure 9 . We can see that Europe and Northern America gather the most important part of rich countries.

Let’s take a closer look at the European Union. The figure 10 shows the GDP per capita by regions, in Europe-26. This map from Eurostat is interesting because we can see which region we can target with more certainty of the people to buy. The regions located in the Netherlands, Germany, Switzerland, Austria as much as the region of Paris are the richest in Europe.

4.2.3.2 Smartphone utilization in Europe
It is interesting to think about which countries use the most smartphones. GOairLight data collection functionality can’t work without the use of a smartphone. The following graph (figure 11) gathers some data from Statista regarding smartphone consumption in countries from Europe. As for the previous map (figure 10), the Netherlands and Germany are the countries with the most higher smartphone adoption rate, so do Sweden or Spain.

4.2.3.3 Bike utilization in Europe
To see which country could be smartly targeted, analyzing the number of sales in European countries can be interesting. The chart below (figure 12) depicts the number of sales per country. As we can see on this chart, Germany was the first buyer of bikes and electronically power-assisted cycles (EPAC) for the 2016 year, followed by France and Great Britain, and then Italy. Someone who is willing to buy a new bike or EPAC is potentially willing to buy the GOairLight sensor for example.

4.2.4 Conclusion
Regarding the market analysis, it could be a good strategy to target Germany, as the GDP, the smartphone adoption rate, and the bike sales in this country are the highest. Furthermore, the name of our product (GOairLight) is an international English name that can be easily understood by the German population.
4.3 SWOT Analysis
SWOT analysis is a management tool used to identify strategies for success. It can be used to guide individual thinking, group discussion, or a large formal planning process. SWOT comes from [41]:
- Strengths: characteristics and capabilities that are superior to the competition and that can be drawn to exploit opportunities and deal with threats.
- Weaknesses: deficiencies where the company needs improvement to remain competitive.
- Opportunities: external factors that could give an organization a competitive advantage.
- Threats: factors that have the potential to harm an organization.
Strengths and weaknesses are relative to specific threats and opportunities.
We can divide the SWOT analysis of our project into two distinct sections: the product SWOT analysis and the team SWOT analysis.
4.3.1 The team SWOT analysis
The team SWOT analysis shows the internal and external factors within our teamwork. You can see the details in the figure 13. The Team SWOT analysis shows clearly where the team hs to put the focus on. For example, it is important for us to know that we are supported by the supervisors and the teachers and that they are here to correct us to make improvements. However, we must know our threats and consider them so that we can thwart them.

4.3.2 The product SWOT analysis
The product SWOT analysis is shown in Figure 14. This figure is a summary/conclusion of the previous Marketing Analysis chapter. According to this analysis, it is important, as a company, to have a clear idea of what the threats are so that we can oppose them. We have to put the focus on making GOairLight concept attractiveness: emotional branding can be a solution that uses the user's emotions to create a strong relationship between our product and their emotions. Even though the legislation is frequently changing over time, we want the customer to be up-to-date with our product. The accuracy of our sensor can then be outdated if laws change. To finish with, one of the threats that can destroy our product utility is the incremental implementation of pedestrian-only cities. What surprising it may be, if we want GOairLight to work in good conditions, we must put the focus on medium-high polluted cities.
However, some legislation opportunities may help the implementation of GOairLight: the trend is to avoid congestion and pollution especially in city-centers and regulations tends to promote bike utilization. In Germany for example, cities are made car-unfriendly thanks to a range of restrictions and taxes on car ownership [42]. In the situation of the COVID-19 outbreak, the bike industry is still running as bike shops remain open. Bike is seen as a social distancing tool against the virus.

4.4 Strategic Objectives
Strategic objectives are statements that indicate what is critical or important in our organizational strategy. We decided to use SMART goals Figure 15:
- Specific (simple, sensible, significant).
- Measurable (meaningful, motivating).
- Achievable (agreed, attainable).
- Relevant (reasonable, realistic and resourced, results-based).
- Time bound (time-based, time-limited, time/cost limited, timely, time-sensitive). [43]

GOairLight strategic objectives :
- 2020-03-05 Define the Project Backlog (what must be done and key deliverables - every member should preferably participate in every task), Global Sprint Plan, Initial Sprint Plan (which tasks should be included, who does what) and Release Gantt Chart of the project and insert them on the wiki (planning)
- 2020-03-10 Upload the “black box” System Diagrams & Structural Drafts to the wiki
- 2020-03-27 Upload the detailed System Schematics, Structural Drawings & 3D Modelation to the wiki and do the cardboard scale model of the structure
- 2020-04-01 Upload the List of Materials (what & quantity) to the wiki
- 2020-04-08 Upload the Interim Report and Presentation to the wiki. The report must contain the the following chapters: Introduction, Project Management, State of the Art, Marketing Plan, Eco-efficiency Measures for Sustainability, Ethical and Deontological Concerns, Proposed Solutio,n and Bibliography. In particular, the Project Management chapter includes the updated project progress register, the sprint report for completed sprints (tasks that were included, statuses, assignees, allocations) and the updated release Gantt chart
- 2020-04-16 Interim Presentation, Discussion and Peer, Teacher and Supervisor Feedbacks
- 2020-04-23 Upload the List of Materials (provider, price, quantity, including VAT and transportation) to the wiki
- 2020-04-30 Upload the Final video of the 3D Model to the wiki
- 2020-05-06 Upload Refined Interim Report (based on Teacher & Supervisor Feedbacks) to the wiki
- 2020-05-13 Upload Packaging solution to the wiki
- 2020-06-02 Upload the results of the (Prototype or Simulation) Functional Tests to the wiki
- 2020-06-12 Upload the Final Report, Presentation, Video, Paper, Poster and Manual to the wiki
- 2020-06-16 Final Presentation, Individual Discussion and Assessment
- 2020-06-19: Update the wiki, report, paper with all suggested corrections. Hand in to the EPS coordinator :a pendrive with the refined deliverables (source + PDF) together with all code, drawings and models produced a printed copy of the final report, poster, brochure and leaflet
- 2020-06-23: Demo of prototype or 3D model, simulation and companion applications. Hand-in the user manual. Receive the EPS@ISEP certificate.
4.5 Strategy/Targeting/Positionning/Brand
According to the definition from Investopedia [45] , segmentation refers to “aggregating prospective buyers into groups or segments with common needs and who respond similarly to a marketing action”. This part is important in the marketing field because it helps understanding who the final user really is. This subchapter will go through the need created by GOairLight, the user’s motivation, and the information point about the product and the ways they can get it.
4.5.1 Needs, motivation, information and purchase
According to An introductory note on marketing management, Michael Pearce (2008) [46], the marketer should answer the following questions while trying to think about the needs, motivations, information, and purchase:
Needs: “What wants and needs are people trying to satisfy? What is particularly important to them? […] Are the needs and wants strong or weak?”.
Motivations: “What motivation lies behind the choice of a product? […] Is the buyer more interested in low initial price or low operating costs?”
Information: “Where do they get information about products […] as they proceed through a process of considering a purchase? Where do they shop, and why there?”
Purchase: “When do they go through this shopping/purchasing process?”
The following figure (figure 16) shows the answers to those questions.

The bike segmentation is quite difficult to undertake because the choice of dimensions (customer-bases, sensitivity, place of distribution, etc.) is endless. The following table (Table 17) shows the different user types for bikes. A quick explanation is given to show why the user type is an interesting target or not.
| Type of bike user | Positive (+) and negative (-) points | Target market? |
|---|---|---|
| Leisure/tourism | A huge number of users (+), Huge area of diffusion (+), No relevant data during rush hours (-) | No |
| Off-road | No relevant data during rush hours (-), Not relevant use (-), Not in the cities (-) | No |
| Racers | Same as off-road users | No |
| Teenagers/children | Too young to get the point (-), Not enough diffusion (-) | No |
| Workers/commuters | Relevant data during rush hours (+), Huge number of users (+), Good area diffusion (+), Category the most affected by air pollution (+) | Yes |
As shown in the table above, working commuters are the most-likely kind of bike users to be targetted by our company. A commuter is someone who regularly travels between work and home. This target is really interesting for us because of the following reasons:
- Commuters cycle daily between their living space and their working area,
- They are more willing to take polluted routes/next to highly busy routes,
- They take part in the working class which means that could potentially afford GOairLight.
In other words, commuters can be good data collectors.
Moreover, a bunch of associations were created in favor of bicycle commuters. For instance, Bike2Work is an EU co-funded project lead by the European Cyclist's Federation “to encourage a significant modal shift from motorized commuting to cycling” [47].
4.5.2 Strategy/Positioning
GOairLight aims to create a community around the city air quality, to raise people’s awareness regarding air pollution. We are planning to sell a quality product, meaning we want the customer to have faith in the product, rather than focusing on the number of sales. This is an outside-in approach, also called a customer-centric perspective [48] . To understand where GOairLight is positioned within the market, a positioning matrix was made (see Figure 17). Regarding the 8 bike-computers assessed, the graph shows that there is a gap in the low to medium multifunctional devices.

The matrix above shows the situation of GOairLight compared to its competitors. According to Porter’s generic strategy [49], to be the leader in the market, our product must be the lowest-cost in the production and on the market. It must differentiate from the competitor's thanks to innovation and it's high-quality: we want to offer the customer a high-quality computer bike sensor. GOairLight is offering a new combination of two useful tools: one improving the safety of the cyclist and another one which helps the community a better knowledge about the city’s air quality.
To have clear strategic objectives, the team decided to start the production of the product from 1000 units. According to our estimations, 1000 units may lower the production price, so that the margin is higher and the team can make more profit over it. 1000 units can be easily reached if GOairLight satisfies one or more municipalities. In that way, the number of devices sold can be higher than 1000 units. The strategic objective is then reached.
4.6 Adapted Marketing-Mix
Adapting marketing is taken by marketers to actively track and respond to consumers. It refers to how the marketers adapt to the target market to suit the particular geography in which the firm is operating [50]. To better understand this approach, we are going to use the four Ps of the marketing mix: price, product, place, promotion as shown in the Figure 18.

- Purpose: The purpose of our product is to benefit from information about the air quality surrounding the user/cyclist, whilst he is moving. In the meanwhile, the device partly ensures the security of the user by providing a front light that automatically turns ON/OFF depending on the light intensity. The final purpose is to gather people, citizens around the cause of air pollution in cities.
- Price: The price the user must pay to use GOairLight is from two kinds: the cost of the product and the cost of utilization. Apart from the price, the user takes his time to use the bike instead of a motorized way of transportation. The cost of time can be lowered using prevention around air quality issues in big cities. We can use for that emotional branding to decrease the cost of time.
- Promotion: Our awareness campaign should be on social networks: this is a low-cost way of advertising and for people to get to know us. Furthermor,e we can attract a large range of people (see Social networks: Facebook, Instagram). We also created a leaflet, that can be distributed as an advertising solution. However, and to respect our sustainability action plan, we prefer not to use this kind of advertisement.
- Place: We want to target businesses (B2B) and final consumers (B2C). For that, we are planning to create a website in which the customers can buy our product. We can also have visibility on the PlayStore, a platform where customers can find the GOairLight app. Regarding businesses, one of our plans is to have city bikes equipped with the product: we can have then advertising from the city and then more buyers.
4.7 Budget
Advertisement is an important part of marketing. We decided to focus on social media, but today, the marketing opportunities are huge. Social media and the world of the internet create several different portals for advertising and company presentation. Social media, in particular, is “free” advertising and that is the reason why we want to focus on that. Our budget is 5000 € at the start but we can always invest more in marketing if we feel like it's necessary. Marketing budget calculations are presented in Table 18:
| Budget | Amount |
|---|---|
| 500 € / month | |
| 500 € / month | |
| Google Ads | 1 459 € / month |
| Leaflet | 500 € |
| Nextbike | 2 024 € |
| Total | 4 983 € |
Facebook, Instagram and Google are monthly plans so we are going to need monitories monthly if we want to continue buying ads from these providers. Every month we check how much clicks to the website we have gained from each ad provider and how many purchases it has led to, that’s the only way we will know if the adds are worth it. If they are, we are going to continue our monthly plan or think about investing more into it.
4.7.1 Facebook
Facebook ad prices CPC (cost-per-click) is 0.97 dollars and CPM (cost-per-impressions) is 7.19 dollars [51]. As mentioned in this chapter, the targeted group is German population, and people from 16 to 65 years. Potential reach was 29 000 000 people and estimate reach was from 5 500 to 16 000 people and from 58 to 168 clicks, with monthly ad and total cost of 500 € (Figure 19):

4.7.2 Instagram
Instagram ad prices CPC (cost-per-click) is from 0.20 dollars to 2 dollars and CPM (cost-per-impressions) is 6.70 [53]. We created our Instagram ad selected target groups was Germany and people between 16 to 65 years. Potential reach was 21 000 000 and estimate reach was from 4 400 to 13 000 people and from 59 to 169 clicks, with monthly ad and total cost of 500 € (Figure 20):

4.7.3 Google Ads
4.7.4 Google Ads
Google ads prices are different from Facebook and Instagram prices. Google Ads is a cost-effective pay-per-click advertising platform where businesses pay based on interactions, such as a click. The average cost per click, or CPC, is 2.69. However, CPCs range greatly from under 1 to +20. The average small business using Google Ads has an ad spend of around 1 500 to +3 000 per month [55].
We decided to invest a big amount of money from our budget to Google Ads because Google has the biggest market share [56].
We are going to invest an average of 48 € per day which will be 1 459 € per month [57].
4.7.5 Leaflet
We can use leaflets in a variety of marketing capacities. We can mail a brochure with a business card or other collateral material to target customers using a mailing list. To direct sellers take leaflets door to door to call on prospects. Business-to-business providers take leaflets to trade shows to distribute to potential clients and customers. Retail shops also place a leaflet on front counters or in displays for guests to review products while in the store or after they leave.
Here is a picture of our leaflet Figure 21:


4.7.6 Nextbike advertising
We are also going to give our product to Nextbike. Nextbike is a German company that rents bicycles in over 50 cities in Germany and all over Europe. We are giving our product free because we believe both will benefit from it. We compare what our companies would benefit from this cooperation in Table 19:
| GOairLight | Nextbike |
|---|---|
| + Publicity + Advertising + Constantly users (better maps) - Giving the product free (investment) | + Free light + Their customers have change to help environment (more customers) + More eco friendly company. + Publicity |
At the beginning of our cooperation, we are going to give them 22 worth of 2024 € GOairlight products and if cooperation goes well we can invest more for this.
Our main objective with this cooperation is to have gained data already when we release the product, that way we have better and updated maps for the user from day one they purchase GOairLight. So we can use Nextbike as a tester for us and improve our device or software if necessary.
4.8 Strategy Control
Strategic control is concerned with tracking the strategy as it is being implemented, detecting any problem areas or potential problem areas, and making any necessary adjustments [58].
We decided to use common tool PDCA (Plan, Do, Check, ACT) as a strategy control process Figure 22
- PLAN - The first step in the PDCA is the Plan. As the name says, we plan what we are going to do. This is probably the largest part of the effort of the PDCA. The Plan covers a lot of ground. We can see it as several sub-steps or points that we have to address in the Plan.
- DO - This is the actual implementation. Creating the product, actually making it happen. In all likelihood, we will encounter additional problems during the 'Do' that we didn't think of before. That is normal. We just solve them as they come along.
- CHECK - Did our implemented solution work? Did we achieve our goals?
- ACT - The Act is to decide what to do next. This depends on the outcome of the Check. If there are positive results, the process can be standardized. If not, the team will reflect again on the problem and will repeat the cycle. [59]

By using the PDCA correctly, we will achieve our goals and we are going to work as long as needed so we achieve a result that we are all happy with. In addition, we need to do good documentation to maintain the PDCA and to show that we are not skipping any steps in it.
We need to monitor our strategy regularly. Does our strategy work, if not, how do we make it work? Do we reach the desired target group, if not, how do we achieve it? Do our ads work, achieve the desired results, and is the investment in ads worth it? These are just examples of what we need to work around to continue our strategy and make the business a success.
4.9 Conclusion
Air pollution kills 4.2 million people every year as a result of exposure to ambient and outdoor air pollution. GOairLight recommends less polluted routes as a solution to reduce biker exposure to air pollution. The goal is to create a strong value proposition because GOairLight competes with existing solutions. Furthermore, and in the long-term, the team wants to raise customer awareness towards air quality issues as well as road safety. The user must feel connected and part of the community. GOairLight target market is represented by the middle-upper class segment, which owns smartphones and bicycles. After researching the most likely population to use GOairLight probe, the target was the German population, where the Gross Domestic Product (GDP) is one of the highest of the world, and the smartphone and bike utilization score higher in Europe. GOairLight is a novel and unique product, inducing potential customers to pay for this new technology. The SWOT analysis showed that the main threat is the acquisition of both a smartphone and a bike. However, GOairLight team could partner up with municipalities to furnish their bikes, exploring market opportunities. The Product, Price, Promotion and Place marketing mix (4P) helps to adapt the marketing strategy to the target market. In this respect, GOairLight will: provide cyclists and the community with up to date urban air quality information; compete against related high-tech products, with prices ranging from 99 € to 219 €, and contribute to improving the health and safety of the user and community for a price of 149 €; be promoted mostly through social network advertising; and rely on a dedicated information and sales website for retail businesses and end-customers.
5. Eco-efficiency Measures for Sustainability
5.1 Introduction
This 5th chapter on eco-efficiency highlights the sustainability concepts for creating a product in the best environmental-friendly way as possible. Sustainable development concept has been developed over the last 15 to 20 years. The main goal of this concept is to enhance the current well-being of the population without compromising the future generation in fulfilling their needs. A consequence of the over-consumption over the last decades is the loss of biodiversity and ambient pollution in the stream: air, water, ground, etc. These impacts on Earth can be minimized by eco-efficiency measures like recycling, the use of sustainably produced renewable materials, increasing durability, or the use of renewable energy. While trying to implement eco-efficiency measures in the development of GOairLight and achieving sustainable development, we will assess the following dimensions: economic, social, and environmental. The Figure 23 shows the interconnections between the three-mentioned dimensions. As mentioned in the chapters above, GOairLight's goal is to create a community around the air pollution issue. Eco-efficiency can help to create value for society and the company: “doing more with less” is the concept that depicts eco-efficiency, as our company will produce more with less over the entire life-cycle of the product. In the end, we want to provide more customers with GOairLight, and more value creation with less resources (especially energy and waste). The sustainable value can be increased by making accurate, scientifically sound environmental information available to customers and the public [61].

The legal aspects of eco-efficiency and air pollution were discussed on the 2015 Conference of Parties, in Paris. The following chapter shows the improvement that must be undertaken in those 2 important fields.
5.2 Sustainable development goals
The Sustainable Development Goals (SDGs) were set up at the Conference of Parties (COP) in 2015. The review of the 17 SDGs is shown in Figure 24. The SDGs take part in “The 2030 Agenda for Sustainable Development” seeking peace and prosperity for people and the planet. Our product can fit with two of the 17 SDGs :
- 11: Sustainable cities and communities
- 7: Affordable and clean energy

5.2.1 Sustainable cities and communities
The goal of GOairLight is to ensure the safety of the bike user, by using front and sidelight. The awareness of the other road users (car drivers for instance) would then increase and the risk of the accident would decrease. Moreover, having an air quality sensor will help the community dealing with the air pollution issue: by referencing the pollution on the roads, all the bike users can be aware of which road to use to avoid pollution. This is a community approach. According to the United Nations report, the proportion of inhabitants who have decent access to public transports remains low, with an average of 53 percent for urban areas [62]. The symbol of the 11th SDG is shown in the Figure 25.

Improving road safety is a major theme in the 11th SDG. The promotion of walking and cycling is also important because bicycling is by far the most energy-effective mean of transport. It is also the most affordable for the urban poor. According to the European Commission in their report on “Smart choices for cities – Cycling in the city” of 2016 [63], the reasons why people should use a bike is to make the city more livable. Bicycles use less space on the road than cars as well as the parking spaces. Bikes do not contribute to atmospheric emissions, except at the production stage. At the opposite, cars and other road vehicles emit particulate matters (PM2.5 and PM10), as well as nitrous oxides (NO and NO2) among others. Riding bikes daily may improve the global health of the population. A study conducted by de Hartog et al. in 2010 [64] shown that using a bike daily increases the life expectancy of 3 to 4 years.
5.2.2 Afforable and clean energy
GOairLight sensors must use electrical energy to run. We want to convert mechanical energy (human energy thanks to the pedals) into electrical energy via the use of a dynamo. The mechanical energy runs to the dynamo. The dynamo is then used to power the battery contained in the sensor. Using human energy may help to deal with the issue of the energy source as it is not dependent on the energy grid. From a global point of view, the renewable energy sector provides more jobs to people than the fossil fuel energy sector [65]. The symbol of the 7th SDG is shown in the Figure 26.

According to the United Nations, the transport keeps the transition towards renewables very slow. Transport and heating/cooling account for 80 % of the global energy consumption and they didn’t match the waited progress on renewable energies. The following picture (Figure 27) from the Energy Progress Report shows the total percentage of renewable energy used in the transport field. We can conclude that there are still efforts and innovations to make to reach the goal of the 20 % share of renewables until 2020 [66].

5.3 Life Cycle Analysis
5.3.1 Life Cycle Assessment
Life cycle analysis (LCA) is a tool by which a product's impact on the environment through its lifetime is evaluated [68]. It is a “cradle to grave” approach for assessing industrial systems. The LCA takes into account the inputs (flows and energy), the stages of the process, and the outputs represented by the atmospheric emissions, waterborne waste, and solid wastes, as well as the main product and co-products. The typical LCA project plan follows the following stages [69]:
- Definition of the goal (see Section 1.4 Objectives) and scope (Section 3.1 Scope), identification of the context, the product or the technology and the system boundaries,
- Identification and quantification of energy, water, and material inputs and outputs,
- Impact assessment on the potential human and ecological effects of the whole system. Quantification of metrics,
- Data interpretation for the selection of the preferred process or technology.
The following chart (figure 28) [70] shows the interconnections between inputs, the process, and outputs.

The GOairLight manufacturing process will follow the same trend. For the reason that we are not anymore building the prototype, the assessment of the whole system could be done, even though some important information is missing. We still can present similar stages for GOairLight, compared to the figure 29.
 1: You can have a look at the complete list of components in Section 3.3 Material costs calculations
2: Unknown for now
5.3.2 Life Cycle Inventory
The life cycle inventory (LCI) is a tool to quantify inputs (energy and raw material requirements), and outputs (atmospheric emissions, waterborne emissions, solid wastes, and other releases) for the entire life cycle of the product.
GOairLight is a device working with electricity as the only source of energy. However, the energy (electricity) is created by the movement of the pedals, thanks to human energy, which makes it renewable, as long as the human has enough energy to pedal. Using another renewable source of energy (solar or wind) would have been too complicated to set up, and not suitable for our device as well. No material requirement is needed throughout the life cycle of the device. Furthermore, no waste is produced during the utilization phase. However, when it comes to the discard phase, the GOairLight must be split. The different components are not recyclable in the same ways.
5.4 GOairLight action plan towards sustainability
The main goal of the EPS project is to create a whole device that could be, in the future, multiplied on a large scale. This subchapter summarises the actions we will implement within our company to improve the reusability of the product and to reduce the production of waste in the packaging solution.
5.4.1 Reusability of GOairLight
Reusability is one of the important factors to take into account when designing a product. Reusable products score over disposable products when considering the life cycle impacts. A reusable product must be reused for the maximum number of times while in service life [71]. We have decided, for the cause of reusability, to create a service that allows the customer to change the parts of the product that don't work anymore. Figure 30 shows how the process of repair and reuse will look like.

- The user send the probe to GOairlight factory, thanks to his own mean of transportation.
- The device is received and the damaged parts are changed, and replaced thanks to new ones. The broken parts are then sent to the recyclable industry when it is possible, or discard. The customer receives information about the process and the pieces that were broken, as well as how to take care of the probe.
- It is then sent back to the user, repaired or upgraded. With that process, the life expectancy of the product is extended.
The principle of circular economy is then validated: we want the user to reuse our product by repairing and recycling instead of throwing it away (as the linear economy principle will do). In that situation, we are reviewing our waste approach in favour of the good management of resources. To make GOairLight users want to repair their product, we will reward them with gifts from bike stores, or by discounts on a new product. As any company goal, we seek the satisfaction of the user. More than that and as mentioned above, we want to create a strong community around the product and the cause it defends. This is the reason why we don't want to charge the user for any damage and repair on the product, and, at the opposite, reward him for the good action.
5.4.2 Sustainable packaging solution
Packing solution is made from Recycled Pet Textile, which is an eco-friendly fabric made of recycled PET (polyethylene terephthalate) bottles, and has a volume of 180 mm×150 mm×50 mm, and weighs90 g..The fabric has a coating that is flame-retardant, water-repellent, waterproof and breathable. The coating is non-toxic and Azo-free, cold, and oil resistant and printed [72]. The design of the packaging solution considered its standard protective role during transport as well as its reuse as a waterproof bag. The result was a multi-functional object that can:
- hold probe and dynamo during shipping;
- store personal belongings during cycling; and
- carry once removed, the front case.
After unpacking, it can be attached to the frame of the bike using three included Velcro strips. Figure 31 presents the packaging solution, including the package with the device and the re-purposed package.

5.5 Conclusion
GOairLight as the ambition to be energy-free thanks to the human energy input, meaning the cyclist have a control on the quantity of energy needed, and that no energy is wasted. We chose to create a PP based device, because PP is easily recyclable, and most of the sorting centers are equipped to deal with PP [73]. GOairLight is designed to have a real impact on the community as it aims to gather people around the air quality cause while using low energy resources and materials. Our device deals with environmental concerns: The device will help people choosing their bike instead of their car, and is using human energy. However, the battery that is used is composed of Lithium which is responsible for damages on the environment when in the extraction phase. It is economic as it encourages people to use or buying a new bike, and encourages the purchase of bike accessories. Finally, the social part is the power of the community, by the sharing of data to the common cloud.
6. Ethical and Deontological Concerns
In this chapter, we will discuss the ethical aspects of our project. We will attempt to look at the task from different kinds of angles, presenting ethics from engineering, marketing, environmental and legal points of view.
6.1 Introduction
Ever since humanity started forming societies, it became apparent that to function together, we need a set of rules regulating our behavior towards each other. Be it religious commandments, human law, or decorum, without them, our world would fall into disarray. This is no different for our project, or companies in general. Without a set of ethics and laws, most of our everyday life could be very dangerous to navigate. Even with those mechanisms in place, sometimes we find it hard to trust companies.
In this chapter, we will first go over the meanings of ethics in specific fields, such as engineering, marketing, and the environment, as well as legal aspects. Next, we will try to relate those findings to our project.
6.2 Engineering Ethics
Engineers are some of the people with the most direct impact on people’s quality of life. Ranging from civil engineer designing our bridges, through biomedical engineers designing life support systems, up to electrical and mechanical engineers taking care of our everyday mechanical appliances. Those and many more types of engineers oftentimes work on products and technologies that, if done incorrectly, could cost many people their lives and health. With so much pressure on them from just that it is natural that a set of rules other than the law should be applied to their profession.
In response to that, many engineering societies devised principles of conduct to help guide engineers through moral dilemmas associated with their works.
One of those was American Society of Engineers, which created the following [74]:
1. Engineers shall hold paramount the safety, health, and welfare of the public and shall strive to comply with the principles of sustainable development in the performance of their professional duties.
2. Engineers shall perform services only in areas of their competence.
3. Engineers shall issue public statements only in an objective and truthful manner.
4. Engineers shall act in professional matters for each employer or client as faithful agents or trustees, and shall avoid conflicts of interest.
5. Engineers shall build their professional reputation on the merit of their services and shall not compete unfairly with others.
6. Engineers shall act in such a manner as to uphold and enhance the honor, integrity, and dignity of the engineering profession and shall act with zero-tolerance for bribery, fraud, and corruption.
7. Engineers shall continue their professional development throughout their careers, and shall provide opportunities for the professional development of those engineers under their supervision.
While some of those rules concern things already regulated by law, others are simply there to uphold the status and public opinion of the profession or simply the working comfort of fellow engineers. We believe our project must adhere to those guidelines to create a professional and trustworthy brand for our product.
Engineering, however, is not the only ethical aspect we will be dealing with during our project. While as engineers we cannot with good conscience release a faulty product, we cannot advertise it as something it is not either. This is where marketing practices come in.
6.3 Sales and Marketing Ethics
We all know that very often product advertisements blow the properties of their products out of proportion, or deal with half-truths meant to convince the users they need the product. The variety of tactics used is enormous and more often than not, includes quite unethical methods as well, making users pointlessly lose money on products they only think they need. This is why it is so crucial for companies who want to keep their integrity to adhere to a set of ethics while promoting their product. While other methods proved to be effective, the only real and valid way to build a long-standing brand is by gaining the trust of your consumers.
To help with that, some general guidelines have been created [75]:
- All marketing communications share the common standard of truth.
- Marketing professionals abide by the highest standard of personal ethics.
- Advertising is clearly distinguished from news and entertainment content.
- Marketers should be transparent about who they pay to endorse their products.
- Consumers should be treated fairly based on the nature of the product and the nature of the consumer (e.g. marketing to children).
- The privacy of the consumer should never be compromised.
- Marketers must comply with regulations and standards established by governmental and professional organizations.
- Ethics should be discussed openly and honestly during all marketing decisions.
In our marketing, we decided to be, first and foremost truthful to the users and generally fair towards our possible competition. We will try to create a brand that doesn’t hurt its customers by false advertising and do our best to provide them with clear and comprehensible information on the product. We will also emphasize the environmental aspect of our product, which leads us to the next section – environment ethics.
6.4 Environmental Ethics
Ever since the industrial revolution, when various industries have begun to destroy the nature, either by resource exploitation, ecosystem destruction, pollution, or a combination of those [76], it would seem that ethical production is the only way we can stop our planet from becoming uninhabitable. In the current situation, it is in the best interest of producers to look past contemporary gain, towards more long-lasting consequences of their actions.
The concerns of environmental ethics are endless. What are the best energy sources? How will they behave in long term exploitation? When will the production cost be returned? Are “cruelty-free” materials environmentally friendly? There are no clear black and white answers to those questions. Oftentimes while trying to fix one problem with the product, producers are forced to use different solutions that are not ideal either.
One of the more famous examples of that is probably faux leather. On the outside, it looks like an amazing solution to the problem of animal exploitation, which in turn would contribute to decreasing greenhouse gas emissions [77]. However, this very same leather, depending on the manufacturer, pollutes the environment during its production and later, decomposition after use. It is also relatively short-lived as compared to leather. All that not even including the environmental racism connected to stigmatizing leather cloth, in relation to indigenous people. So which solution is better? There most likely is no clear answer to that question [78].
In our project we are trying to choose the best options we can, taking into consideration the nature of the product and the technical aspects of materials we are forced to use. We are aware that our solution of powering our device using dynamo with batteries is not a perfect one, but it is still one step in the right direction and we will do our best to make sure our solutions are the best out of the ones available to us.
6.5 Liability
Liability concerns the legal aspect of creating a product. It aims to make sure the product follows adequate directives and laws.
Our project should adhere to the following European Union directives:
- Machinery Directive (2006/42/CE 2006‐05‐1705‐05‐1717) - ensures the safety of the machinery and its components entering the European market. However, this particular directive doesn’t concern our product [79].
- Electromagnetic Compatibility (EMC) Directive (2004/108/EC 2004-12-15) – Due to the nature of electrical current, different household appliances ten to interfere with each other. This directive aims to ensure such interference is minimal and doesn’t pose danger to the user [80].
- Low Voltage Directive (LVD) (2014/35/EU 2016-04-20) – Ensures the safety of electrical devices of voltage between 50 and 1000 V for alternating current or 75 and 1500 V for direct current [81].
- Radio Equipment Directive (RED) (2014/53/EU 2014-04-16) – concerns products, which, like ours, use radio for communication. It ensures the safety of the users and the lack of interference of the radio with other devices. It is also responsible for regulating the safety of user data sent using those means [82].
- ROHS EU Directives – restrict the usage of harmful substances in devices, allowing for more efficient recycling [83].
- Measuring Instruments Directive (2014/32/EU) – ensures that the scientific measurements (in our case CO2 level and temperature) are done accurately [84].
As we can see, some of those directives apply to our project and we plan to heed them in our design. Most notable are the last three, as they most strictly apply to our project.
6.6 Conclusion
In response to our ethical and deontological research, we believe that our team should first and foremost concentrate on sustaining our integrity as engineers. Only then we can be sure that the product we will provide will be created with the good and safety of the users in mind. We believe in adopting a policy of truth in contact with our customers, making sure our company is as transparent as it can be without compromising our client's sensitive data. Moreover, for the sake of the success of our project, we will ensure that our products are compliant with European Union Directives, which not only will allow our project to be launched at the European market, but also provide additional security standards for our users.
Finally, we will strive to choose the most environmentally friendly components and design possible, carefully considering the individual impact of each element. We are aware that environmental ethics are a multifaceted problem and we will try to solve our problems in accordance with our conscience.
That being said, the actual components and designs we have decided on using those criteria are depicted in the following chapter on Project Development.
7. Project Development
7.1 Introduction
The design of the bicycle probe had to be thought of carefully for many reasons. The casing of the probe is designed so that the air quality sensor is protected even in the harshest of conditions. This was tackled by incorporating slits into the shell that allowed air to pass to the sensor, however not water. The device was also designed to be detachable, to prevent theft when the cyclist is not on the bicycle.
7.2 Architecture
In this chapter, will be presented: the black box diagram, the mood boards, all the (structural) drawings that were made along with the SolidWorks models and, finally, the detailed schematics of the electronic components.
7.2.1 Black box diagram
The black box diagram is used to visualize all inputs and outputs of a system without paying too much attention to the internal working.

The diagram (figure 32) shows that our main device will be powered by the energy generation of only a dynamo that will charge the battery in the device. The battery then has to power first the Arduino and pollution sensor that will sense the air humidity, temperature, and measure emission levels then transfer this data via Bluetooth to you're smartphone to the application and from that to the cloud where the data will be processed. Secondly, the battery also has to power the LED-headlight that automatically turns ON & OFF when needed using a light sensor.
7.2.2 Look & Feel
This moodboard (figure 33) will help us with designing how attractive the product looks, and hopefully will give the product a sophisticated appearance. We want to make the product feel more like an extension of the bike then that it feels like a bulky and useless gimmick. Clean and simple forms are key to our product to show that the product is user friendly, and hints of green/blue will indicate the ecological part of our product.

7.2.3 Drawings
In this part, we will show the chronological order on how we came to our final design concept with drawings.
7.2.3.1 First Structural Drawings
In this first part, we made a few quick sketches (as shown in figure 34) of what the concept may look like with some features that we are considering on the device.

In the figure 35, we made the first sketch of the concept mounted on the fork of the bike with some of the features we are considering. Afterward, we saw that this option is not a good idea because of the compatibility between other bikes and different kinds of forks.

7.2.3.2 Final Structural Drawings
For the final structural drawings we made two options (as you can see in figure 36). Afterward, we did a trade-off to choose which concept is better for this appliance. We made the trade-off based on user-friendliness, usability, and which design corresponded better to our target audience. We concluded out of the trade-off that the right concept is the better option for our product.

We chose to use only black and gray colors in this concept (figure 37) to keep the product discreet and give it a sophisticated look. On the sides of the device, we put small accent lines that represent the product/company's logo, the green to blue gradient also stands for the eco-friendly aspect of our product.

Our final structural concept will feature the following things: An easy detachable main device with inside a headlight that automatically turns on and off when it gets dark or light outside, an Arduino and pollution sensor that can measure humidity temperature and CO2, this data will then be transferred via Bluetooth to the consumer's smartphone.
7.2.4 Solidworks Model
7.2.4.1 Raw Solidworks Model
In this model (figure 38) you can see how the model is built and where all the parts are placed in the model. The Arduino sits on top, right under it you can see the pollution sensor to the right, and left you can see the reflector with the 3 LED lights. Then completely at the bottom, you can see the 4 x AA rechargeable lithium-ion batteries. The outer left part is an extra cover to protect against rain and the outer right part is the mounting piece where the power of the dynamo comes threw.

7.2.4.2 Technical Drawings
This is the technical drawing from the actual device. The main device as well as the mounting piece for the handlebar.

This is the technical drawing of the packaging solution. This case can be attached to the bike frame using three velcro strips.

7.2.4.3 Renders product

In this render, you can see the components of the device, with their approximate location.

In this render, you can see how to install the mounting piece on the handlebar using three M5 screws. After that, you can install the dynamo on the wheel to generate the power for the main device.

As an extra preference, u can customize the accent stripe on the GOairLIGHT to match your bike frame or use your favorite colors to make the product your own.

7.2.4.4 Renders packaging solution

7.2.5 Schematics of the electronic components
Table 20 shows the connection of the battery to the dynamo.
| Name | Picture |
|---|---|
| Dynamo to Battery Connection |  |
| Dynamo to Battery Connection - Electrical Diagram |  |
| Fritzing Schematic |  |
The connection between the dynamo and the battery consists of few components to aid the charging of our 4 AA batteries. Firstly, there are four diodes in the circuit, also known as a half-bridge rectifier. The job of the H-bridge is to switch the polarity of the voltage, it also allows the load current to flow in both directions.
Next comes the step-up (boost) converter. The job of the boost converter is to determine the output voltage whilst charging the batteries. It then allows for a wide range of output voltages that can be decided by the manufacturer. The protection of the electrical components is provided by the step-up converter.
The boost converter then connects to the four lithium-ion batteries, which lead to the half-bridge, returning to our power source of the dynamo.
7.3 Components
7.3.1 Air Quality Sensors
A comparison between 3 air quality sensors is given in Table 21:
| Name | Pros | Cons | Price (€) | Picture |
|---|---|---|---|---|
| BME680 [85] | * Having 4 sensors in one is a big plus. Despite the high price, it’s providing more value in comparison with the other sensors in this post. * High availability and produced by a well-known sensor company. * Best-in-class power consumption. * Best-in-class operating voltage range (1.8-3.6V). | * More difficult to integrate into Particle firmware. * Static library does take up more memory and flash space. This could make or break applications depending on the processor. * Humidity and Temperature measurements appear to be less accurate. It may still require another temperature, humidity sensor (Which defeats the purpose of an all-in-one device). | 22.50 |  |
| SGP30 [86] | * From a firmware perspective it’s almost as easy as the CCS811. * This chip is way more sensitive than the CCS811. * This device is widely available through many channels. | * Requires extra hardware to run this device. Need small a regulator and some level shifting which will add another $0.5 in small volumes. * Requires extra floating-point operations to get the absolute humidity. (for the humidity compensation) This is not the end of the world but if you have a process without an FPU you could run into trouble. * Calculating the Maxim CRC8 makes it a bit troublesome if you don’t have your head wrapped around it. | 19.95 |  |
| CCS811 [87] | * By far the easiest part to integrate. There are tons of open source libraries to use. * You can update the device via an I2C boot loader. * AMS is a great sensor company. They make awesome products. Lots of other companies have trusted with what AMS has built here. * Has a higher operation voltage range (1.8 - 3.3V). | * No stock. And if there is stock, it goes poof, fast. * Not sure how accurate it is. Wild C02 readings but also TVOC readings that don’t match up with the other sensors what is compared here. | 19.95 |  |
After comparisons between all sensors, considering all of them are in simmilar price and quality range, we decided to use sensor CCS811, since it is the easiest one to integrate in the project without the need for the user to calibrate it before first use.
7.3.2 Dynamo Component
The comparisons of several dynamos are shown in Table 22:
| Name | Characteristics | Price (€) | Picture |
|---|---|---|---|
| AXA HR Traction Power Control Dynamo [88] | * Extra large runner that offers high efficiency in adverse conditions * No cable or mount * Durable * Easy to use * Overvoltage to prevent extreme current flows * 6 V / 3 W | 28.50 |  |
| SHIMANO Nexus Front Hub Dynamo [89] | * Comes with LED headlamp * 6 V / 3 W * Aluminium shell * Durable due to shell | 43.83 |  |
| Exposure Revo Dynamo Hub [90] | * Light weight * 6 V / 3 W * Quick release | 76.85 |  |
Comparing the three dynamo components together, it is clear that the dynamo that will be used to go forward with our project will be the AXA HR Traction Power Control Dynamo. This is due to a variety of reasons. These include; mounting - this dynamo is easier to connect to the bicycle in comparison with the other dynamo options. The dynamo's durability - the dynamo is manufactured from strong aluminum to protect the device in bad conditions. The AXA HR Traction Power Control Dynamo also has an overvoltage to prevent a very large current escaping from the output and finally, the dynamo is the most cost-effective out of all of our options.
7.3.3 Battery Component
The comparison of different rechargeable batteries is shown in Table 23:
| Name | Characteristics | Price (€) | Picture |
|---|---|---|---|
| 6 Volt 4.5Ah Rechargeable Lead Acid Battery [91] | * Dimensions - 100x70x47 mm * Can be used in series and or parallel * Economical - made from low cost and readily available materials * Impact resistance case * Wide operating temperature * Service life of 4 to 5 years | 10.81 |  |
| Power Sonic PS-630 6 Volt 3.4Ah Rechargeable Lead Acid Battery [92] | * Dimensions - 60x133x34 mm * High discharge rate * Impact resistance case * Easy to handle - classified as non-hazardous * Long service life | 9.73 |  |
| Sealed Lead Acid Battery 6V 1.2Ah [93] | * Dimensions - 97x24x58 mm * Durable * Lead-acid * Long service life | 6.99 |  |
| Duracell Recharge Plus, Rechargeable AA Batteries [94] | * Dimensions - 50×14(diameter) mm (x3) * Lithium-ion * Charged up to 400 times * Small size * Lightweight | 4.50 |  |
| LADDA Rechargeable battery, HR6 AA 1.2 - 1.5V [95] | * Dimensions - 50×14(diameter) mm (x3) * Recharge 500 times * Life time: 5 years * Battery capacity: 2450 mAh * Lithium-ion | 6.24 (4pk) |  |
The battery that we decided to use is the LADDA Rechargeable battery, HR6 AA 1.2 - 1.5V (x4). We decided this as it the most cost-effective battery as well as being the easiest to access. The batteries were also easy to charge when placed in a battery box and suited our voltage specifications.
7.3.4 Arduino Board Component
When thinking of microcontrollers, to a more seasoned programmer the first thing that comes to mind is most likely microcontrollers like AVR,[96] ARM[97], or similar. However, those are generally very complex and time-consuming to put together and require a very thorough knowledge that is usually hard to find.[98] We decided that using a premade board will allow us to both take advantage of the board's library, as well as, when needed, accessing more advanced options directly from the board's microcontroller.
This led us to consider between Raspberry Pi[99] board and Arduino.[100] Our first concern with Raspberry was that it doesn’t operate well in a scenario of sudden shutdown due to power cutoff. For the program to work without deteriorating, Raspberry requires a proper shutdown. In our project, this could prove difficult because of the very nature of our powering system. We’d like to believe no power shortages should occur, thanks to the batteries, but it is still a risk nonetheless. However, an advantage of the board is being based on the ARM microcontroller, which one of our teammates is more accustomed to than the Arduinos AVR microcontroller. Still, the greater price, powering problems, and Raspberry being overall more complicated than it is needed for our project, are factors that spoke against it greatly.[101]
Finally, we decided on Arduino, which is relatively simpler than Raspberry, offers a great variety of resources. It's one thread architecture is more than enough for the tasks we need it to perform and react better to power shortages than Raspberry. It is well adapted to working with peripheral devices like sensors, which are crucial in our project.[102]
However, since Arduino has a broad offer of different devices, we had to choose one best suited to our needs, which is depicted in Table 24:
| Name | Wireless Connection | Dimensions | Other Characteristics | Price (€ tax not included) | Photo |
|---|---|---|---|---|---|
| Arduino Nano 33 IoT [103] | Wi-Fi and Bluetooth | 45 x 18 mm | * CPU Flash Memory 256 kB * SRAM 32 kB | 16.00 |  |
| Arduino Nano 33 BLE [104] | Bluetooth with NFC | 45 x 18 mm | * CPU Flash Memory 1 MB * SRAM 256 kB | 17.50 |  |
| Arduino Uno Rev3 [105] | None | 68.6 x 53.4 mm | * Flash Memory 32 kB * SRAM 2 kB | 20.00 |  |
| Nano 33 BLE Sense [106] | Bluetooth | 45 x 18 mm | * CPU Flash Memory 1 MB * SRAM 256 kB * 9 axis inertial sensor * humidity, and temperature * barometric * gesture, proximity, light colour and light intensity | 27.00 |  |
| Arduino MKR Wi-Fi 1010 [107] | Wi-Fi and Bluetooth | 61.5 x 25 mm | * CPU Flash Memory 256 kB * SRAM 32 kB * Battery Li-Po Single Cell | 27.90 |  |
| Arduino MKR1000 [108] | Wi-Fi | 61.5 x 25 mm | * Flash Memory 256 kB * SRAM 32 kB * Battery Li-Po Single Cell | 30.99 |  |
From the following possible products, we decided to finally use the Nano 33 BLE Sense board. The factors we took under consideration was whether the device had either a Wi-Fi or Bluetooth connection, since our project requires data transfer, outside of the device. We finally decided to concentrate on the Bluetooth module, since in general this form of communication has lower power consumption, which is crucial in a device powered by kinetic energy. It is also a more friendly option for users who lack mobile data on their phones. This left us with Arduino Nano 33 BLE and its extended version Nano 33 BLE Sense. The main difference between the two being the Sense version having already some sensors that interest us implemented. We believe using integrated sensors has the merit of them being picked by the manufacturer and dedicated to this specific board, bypassing the need to write specific drivers for each sensor.
7.3.5 Step-up (Boost) Converter
The chosen Step-up boost converter is shown in Table 25
| Name | Price (€) | Picture |
|---|---|---|
| LiPo Charging With Step Up Boost Converter Module [109] | 2.26 |  |
A step-up (boost) converted was introduced to the dynamo - battery connection to determine the output voltage whilst charging the Lithium-ion batteries. It also allows for a wide range of input voltages. Overall, the step-up converter will additionally provide protection from voltage and current spikes.
7.3.6 LED Light
The chosen LED for our bicycle probe is shown in Table 26
| Name | Price (€) | Picture |
|---|---|---|
| SSC Seoul P4 (U-bin) LED emitter (x3) [110] | 2.28 |  |
This LED was chosen as it operates at an acceptable voltage of 3.7 volts. The three LED's will be attached to the front of the device to provide a light whilst the cyclist is in transit on the bike. It also projects a white light which is the most common for a forward-facing light. The dimensions of each LED is 8x5x8 mm.
7.3.7 Additional Components
- 4 x 1.5V battery box
- 4 x 1N4007 diodes (bridge rectifier)
- Electrical wire
7.3.8 Power Calculations
The power calculations are shown in Table 27
| Component | Voltage (V) | Current (mA) | Power (W) |
|---|---|---|---|
| SSC Seoul P4 (U-bin) LED emitter (x3) | 3.7 | 12 - 20 | 0.056 (x3) |
| Arduino Nano 33 BLE Sense board | 3.3 | 15 | 0.05 |
| CCS811 Air quality sensor | 3.3 | 26 | 0.086 |
| H-bridge | 5 | 0 - 36 | 0.18 |
| Total | 0.484 | ||
7.4 Casing
We are going to produce prototype casing using 3D printing and the final production will be made using injection molding.
7.4.1 3D Printing
3D printing or additive manufacturing (Figure 47) is a process of making three dimensional solid objects from a digital file. The creation of a 3D printed object is achieved using additive processes. In an additive process, an object is created by laying down successive layers of material until the object is created. Each of these layers can be seen as a thinly sliced horizontal cross-section of the eventual object. 3D printing is the opposite of subtractive manufacturing which is cutting out / hollowing out a piece of metal or plastic with for instance a milling machine. 3D printing enables you to produce complex shapes using less material than traditional manufacturing methods. Adoption of 3D printing has reached critical mass as those who have yet to integrate additive manufacturing somewhere in their supply chain are now part of an ever-shrinking minority. Where 3D printing was only suitable for prototyping and one-off manufacturing in the early stages, it is now rapidly transforming into a production technology [111].

7.4.2 Injection molding
Injection Molding (Figure 48) is a manufacturing process for producing parts in large volumes. It is most typically used in mass-production processes where the same part is being created thousands or even millions of times in succession.
Why Use Injection Molding: The principal advantage of injection molding is the ability to scale production en masse. Once the initial costs have been paid the price per unit during injection molded manufacturing is extremely low. The price also tends to drop drastically as more parts are produced [113].

7.4.3 Material
For material we chose plastic. There is a wide selection between different kinda plastics and they all have different properties. We need to choose material that we can use in 3D printing and injection molding. Only thermoplastic materials can be used in injection molding so we compared different thermoplastics and their use in Table 28
| Material | Abbreviation | Usage |
|---|---|---|
| Poly(methyl methacrylate) | PMMA | Paints, decorations, glass substitutes |
| Polyethylene | PE-LD | Plastic bags, pouches, cords |
| Polyethylene | PE-HD | Pipes, cans, bottles, some wood composites |
| Polypropylene | PP | Household goods, car parts, textiles, some wood composites, construction products (including sewer pipes) |
| Polystyrene | PS | Tableware, toys, cases and boxes, capacitors |
| Polyethylene terephthalate | PET, PETE | Soft drink bottles, fishing lures |
| Polyvinyl chloride | PVC | Construction products (including sewer pipes), conductor insulators and cable sheaths, rainwear, some wood composites |
| Polyamide | PA | Clothing (nylon), toothbrushes, machine parts |
| Polycarbonate | PC | Sunglasses lenses, CDs, riot shields, safety glasses |
| Polylactic acid | PLA | 3D-printing |
| Polytetrafluoroethylene | PTFE | Coatings (Teflon surface of frying pans), pipe sealing tape |
| Polyoxymethylene | POM | Gears, plain bearings, screws |
| Ethylene chlorotrifluoroethylene | ECTFE | Process industry piping, tank coatings |
| Polyvinylidene fluoride | PVDF | Filters, microchips, pipes, valves, bearings |
| Acrylonitrile butadiene styrene | ABS | Household and office machines, enclosures, pipes and profiles, boats, 3D printing |
We decided to use thermoplastic Polypropylene (PP) because of PP's features fit perfectly to our needs:
- Polypropylene is readily available and relatively inexpensive.
- Polypropylene has high flexural strength due to its semi-crystalline nature.
- Polypropylene has a relatively slippery surface.
- Polypropylene is very resistant to absorbing moisture.
- Polypropylene has good chemical resistance over a wide range of bases and acids.
- Polypropylene possesses good fatigue resistance.
- Polypropylene has good impact strength.
- Polypropylene is a good electrical insulator.
Polypropylene is a very useful plastic for injection molding and is typically available for this purpose in the form of pellets. Polypropylene is easy to mold despite its semi-crystalline nature, and it flows very well because of its low melt viscosity. This property significantly enhances the rate at which you can fill up mold with the material. Shrinkage in polypropylene is about 1-2% but can vary based on a number of factors, including holding pressure, holding time, melt temperature, mold wall thickness, mold temperature, and the percentage and type of additives [116].
7.5 Functionalities
7.5.1 Software
Application:
The application is used In order to connect the device with the Cloud and provide the user with data in real-time. The data exchange between device and application is made by Bluetooth and between the application and cloud by WiFi or telephone data. The elements of the application are as follows:
Welcome screen: Shows application logo. Features popup windows with requests to enable Bluetooth and localization. On the first run of the application another window will ask for agreement to terms of service.
Top naviagation bar:
- login/logout button
- currently logged in user e-mail
- button triggering popup with explanation on community data use
Menu: Three buttons at the bottom of the window:
- Home
- Map
- Settings
Home screen: Displays in both graphic and numerical manner the CO2 concentration in the users location, sourced directly from the device. It also shows current temperature and humidity, also obtained from the sensors. On this page there are two buttons, leading to popups with information about the application and one for connecting the device.
Map: Takes advantage of data downloaded from the cloud database. It mainly functions as a navigation tool, showing path taking under consideration community data. The app would determine the least polluted road to and from points specified by the user. This would be achieved by assigning each intersection as a node and the distances between them as a mean of the pollution measurements along them. Then, using a backtracking algorithm, all possible routes would be found, from which an optimal route could be determined. The map itself was created using OpenStreetMap API, with the use of some additional libraries in order to display markers and polylines on the map and parse the raw .osm files for routing.
Settings: page with settings for the application and containing general information about the status of the device, short note on the development team along with social media links, user account settings and local data reset.
Other technical aspects: the application is created for devices with android 5 or higher, thanks to which the application can run on 94,1 % of all distributed devices, the statistic courtesy of Android Studio. We believe that since the application is not very complicated and needn’t rely on the newest features, it should have a high backwards compatibility with the system.
Database: Internal database makes use of SQLite, allowing for quick fetching of the data. I comprises of 3 tables, one for localisation and carbon dioxide measurements, updated from the device every 5 seconds. Second one is reserved for temperature and humidity measurements and updated every 2 minutes. Both tables also contain a timestamp from when the measurement was taken. Final database is used only at runtime, for temporary storage of data downloaded from IoT database. External IoT platform used is Google Firebase' Firestore. It compises of collections of documents each containing a measurement along with timestamp and user id. This platform is also used for handling user authentication.
The user case diagram (Figure 49) represents the dependencies and functions of the system.

Arduino software:
The Arduino software has two primary functions. One is to gather data from the sensors in timed intervals, using built in timer and sending them via Bluetooth module to the application. The second one is to detect light levels and turn on the front light in response to that.
The software works in a loop, checking the light level and then switching the level output on pins connecected to the front light. Next it should check whether a Bluetooth conncection has been established. If so, is should read all sensors and send the results to the application.

7.6 Tests and Results
7.6.1 Tinkercad Simulation
For the simulation of the control system of our probe, a software called Tinkercad was used. Due to the availability of certain components on the software, several substitutions had to be made, for the purpose of the simulation.
Instead of a dynamo, a Hobby Gearmotor was used. As this rotated, it was used to demonstrate the dynamo rotating when the cyclist is in transit on the bicycle. Unfortunately, rechargeable batteries were not available on Tinkercad, however, this was overcome by connecting the Gearmotor to the case of four batteries to simulate the dynamo charging the batteries with the kinetic energy. The Hobby Gearmotor was also connected to the inputs and outputs of the H-Bridge on the breadboard.
The charged batteries provide power to both the breadboards, and the Arduino. For the purposes of this simulation, the step-up boost converter was not included, but instead, be included in the Arduino code. To protect the LEDs from high current, a 300 ohm resistor was added before each one. A gas sensor was used to replicate our air quality sensor.
The H-Bridge is connected to the digital pins of the Arduino.


Tinkercad Simulation Results
When the programme is running, it is clear that the three LEDs are on. The spinning Hobby Gearmotor depicts the dynamo moving and generating kinetic energy, which in turn, charges the batteries. The dark cloud surrounding the gas sensor is simulating our air quality sensor retrieving data from the environment whilst the user is on the bicycle.
7.6.2 Arduino software testing
In order to test the software for the Arduino we created an approximation of the system in Tinkercad, that additionally included a photoresistor and temperature sensor. Moreover, for better visualization of the results, 3 diodes were placed to imitate the colour indicator of the application. The results from the sensors were also printed in the console.
We can observe the simulation in Figure 53 and Figure 54:


In Figure 55 we can see the function controlling the light switching. First, the light level output is read from the sensor pin. Then, if the light is insufficient all 3 pins connected to lights are set to high level, otherwise they are set to low in order to turn the lights off when not needed.

Figure 56 shows reading of the air quality sensor and sending the data via Bluetooth.

In Figure 57 a function controlling the temperature redings is shown. Like the previous one it reads and sends data via Bluetooth but also converts the sensor output to Celcius.

Finally, Figure 58 shows part of the main loop where functions which use Bluetooth are called if the conncetion is available.

Software testing results
The front LEDs react appropriately to the changes detected by photoresistor. The temperature is printed correctly and matches the one set on the sensor. Finally, the diodes indicating pollution react to the change in proximity between the sensor and the source of pollution.
7.6.3 Application testing
Due to the circumstances we could not test the connection between Arduino and the application. In order to test the main functionalities, we generated fake data while traveling around the streets. This data was then used to fill both the internal and external storage. Next it was downloaded back from the database and used to simulate routing in the map component. We also tested the user authentication by creating some accounts and emulating casual use of the application while logged in.
In the home screen Figure 59 the user can view the data that is currently gathered by their device. The current pollution levels are also visualised using different colours of the logo. Upon clicking the “i” button, the user can see an explanation of the graphical representation of the pollution and the Bluetooth button. In all screens, in the top left corner the user can login or logout. The “?” button triggers a popup explaining the need for authentication.


The login button opens the login screen Figure 60 allowing for authentication with username and password. The password can be set as visible using the “eye” icon.


In case of forgotten password, new window opens Figure 61 prompting for the user's email in order to send verification message.

In case the user has no account, signup button opens new window Figure 62 allowing the user to register with their email and password of choice.

The map page Figure 63 allows the user to set the coordinates of the start and end of their route by clicking on the map or writing them into the text fields. Start is represented by green pointer and end by red one. The user's current location is represented by blue pointer. “Choose city” button allows the user to choose which city to load data for. Start button begins the calculation of the route. Arrow icons allow for quick switch of end point with the start point.


The settings page Figure 64 contains several options. First, the “Reset data” button allows the user to clear their measurement's history on their device. The “About us” button shows a page containing information about the team and the project. Finally, when logged in, the user can change their profile settings using “Edit profile” button. This opens new window (Figure 65).


The update profile page Figure 65 allows the user to change their profile picture by clicking on the current one and choosing new one from their phone gallery. Below, they can change their name, both of whitch are then displayed in settings page Figure 64. Here the user can also change their password and delete their profile upon entering their current password.


In Figure 66 we can see the desktop view of the IoT database storing the measurements performed by all users. IoT platforms usually do not use SQL syntax of tables and keys, so in our project's case we used Cloud Firestore that implements hierarhical stucture of collections and documents. To the left we can see different collections of data, one for each measured value and the locations. Each collection contains documents(in the middle) that each correspond to a single measurement and contain a collection of values associated with it. In the figure we can see to the right a single record of carbondioxide measurement containing the measured value, user key - IdBiker(assigned during authentication), measurement key and a timestamp. Upon download of the data by the application, it associates the measurements with their location using the IdBiker and timestamp fields that are present for each record.

Application testing results
The application passed most of those tests successfully, with the exception of routing, which turned out to be imprecise due to the input data format from the maps’ database. Overall, the map loads, recognizes the users location and shows an approximation of the route the user can travel by, with the consideration of the pollution and distance. Apart from this issue, authentication and profile update work correctly, as do both databases. The application requests permission to use localization and Bluetooth and recognizes when those functions are turned off. Finally, all the minor application functionalities such as buttons and user input work correctly and react to restrictions based on current authentication status.
7.7 Conclusion
This chapter summarized the entire process of creating the prototype visuals, starting from concept and sketches, through technical drawings and finally 3D renders of the product. It shows the steps taken in developing the electronic circuit, which included schematics of the circuits, choosing appropriate components from ones available on the market and calculating the power usage. As the manufacturing process was described, we considered both the method, being 3D printing of the prototype and injection molding for mass production, as well as the materials which should be used. The functionalities of both the application and the device itself were discussed and finally, we recounted the process of testing the circuit elements, Arduino software and the application.
The concept visuals are well defined and thought through. Materials were chosen with great care to make sure they are both ethical and sustainable while still fulfilling the needs and requirements of the project. The circuits were designed to both be safe for the user and to provide a sustainable energy source. The application was designed having in mind the comfort of use for the device owner, allowing them to apply the gathered data in their daily lives with the use of navigation. While regretfully, we could not test it with real data, most of the planned functionalities were realized.
In the next chapter, final conclusions and a summary of the entire project will be discussed along with possible future improvements.
8. Conclusions
The team was initially composed of 6 people, from 6 different universities and backgrounds. Unfortunately and due to the COVID-19 pandemic, one of the team members, Julia, left. Despite this loss and thanks to remote communication, the team kept going forward to fulfill the objectives initially set up. This ending chapter will go through what the team did accomplish throughout this “remote” semester, thanks to an overview of the tasks we managed to do, and finally, how can our product be improved in the “Future development” chapter.
8.1 Discussion
The GOairLight concept is based on an approach that links citizens around the world, through the cause of air quality. How is it possible? GoairLight uploads the data collected by the probe during rides to the cloud, where it remains accessible to the whole community. The Figure 67 shows how exactly the process works. To fulfill this main goal, the team designed an all-in-one device with a light module, air and light sensors, and four rechargeable batteries. The system is powered by a dynamo operated by the cyclist. The proposed design would not be possible without the preliminary work on related products, marketing, sustainability, and ethics. This study led to a viable product that can be easily industrialized, including a sustainable, reusable packaging solution. Besides, communicative supports have been carried out to promote the qualities of GOairLight, like posters, leaflets, or even a self-explanatory video of the 3D model. As far as the prototyping was not possible, the team managed to do everything tasks it was required to do. Instead of doing the prototyping, we did simulate how the app and the device should have been working.

Apart from giving access to pollution levels, GOairLight tries to bring the community around the cause of air pollution, especially in big cities. By collecting data and sharing them with a common cloud, the whole community can have free access to the pollution map. In that sense, people can link together, share their feelings about the air conditions, try new routes provided by the map together and connect to bike users. Furthermore, the device has another important role that is to make people use their bikes. As GOairLigth is made to improve the road conditions for bikes, people are more willing to take their bicycles to commute throughout the city. The feeling of safety can, even more, be improved by the creation of real bike lanes.
8.2 Team members' personnal outcomes
Zuzanna: “My overall experience with the project was very positive. The classes accompanying the project forced me to work outside of my area
of expertise, allowing me a broader look at my field of studies. I have also learned many skills connected to my field, such as knowledge on
embedded systems and mobile android applications. I believe these skills will further aid me in the future both as a student and as a
professional. The online learning we were forced to adopt was a challenge, especially coordinating work with distant teammates. However,
I believe it was a valuable lesson on how to work with remote teams, which is not uncommon in the IT job market”.
Logan: “During the EPS, I have learned how to work in a multinational team effectively and efficiently. The EPS has definitely improved my
communication skills, in terms of conveying different ideas and messages across the board to the whole team. Unfortunately, the COVID-19
pandemic played a big part in our EPS semester. However, skills were still developed through the use of online teaching and video software.
In the time spent completing the EPS, a part that I will look back fondly on, was the opportunity of meeting new people from all over the world
and to contribute my skills in a multi-skilled group.”
Mélissa: “EPS@ISEP was quite a challenge for me as the creation process from the design to the development of a proof-of-concept prototype
is out of my study field. However, EPS is more than the creation of a product, it is about international teamwork. Specifically, it helped me to
develop team management, searching and scientific writing skills. Thanks to this project, I now know more about the marketing field, and its
important role in a company, and how to communicate efficiently through visual communication supports as well as with my team. COVID-19
situation hardened the realisation of the project and made it even more challenging, but we successfully managed it!
Kaan: “I have learned a lot by working together with students from different fields and seeing their strengths and weaknesses. It ranged
from self-learning (working with new tools and improving my design skills) to peer-learning (understanding how other fields are equally relevant
to the design of functional devices). Due to the outbreak of the pandemic, we were forced to switch to distance teamwork, resorting to online
tools for communication. Although it was a challenge, the team was able to continue working and communicating remotely. Overall, this gave me
experience and knowledge on how to work as a team without being physically together.”
Juho: “My experience with the EPS programme has been positive. I have learned how a team should work as a whole and how to improve my own
doing within the group. EPS was not just focused on doing a project, but on learning other skills as well. I have learned other subjects like
Portuguese, basics of coding, project management, marketing, energy and sustainability. The team was composed of students from all over
the world and everyone had a different educational background. Before I used to do my work just before the deadline and now, after this teamwork
experience, I realised that team partners have to work side by side to go further.”
8.3 Future Development
This subchapter go through different options the team can explore to enhance the product. The first option for example is something that we aborted because we didn't have enough budget to do it.
- One of the first steps we worked on was the realization of a side and backlight, to ensure the complete safety of the rider. After deeper thoughts about if it is possible or not, we finally decided to focus only on the front light and skip the 2 other lights. One of the improvements that could be made is then the addition of those lights so that we can promote more about the “security” aspect of the device.
- As already mentioned in the report, and something that could be interesting to do for having more customers and reaching a larger community is to partner up with communities of cities: we could, in the future, give (for free) the device to some communities for them to equip the bikes of the city. 2 positive points can raise: GOairLight would have more visibility to the customers as the devices would be on the city bikes, and we could then collect the data from the bikes and sell them to air quality centers.
- Improve the polluted route navigation and develop version of the application for iOS devices. Expand the application means of showing the data.
Bibliography
This section shows the sources that were used to create the content of the report. Websites, reports, articles, and papers were the main sources used.